
Featured Research
Macroeconomic Insights: France CPI, Energy and the OAT-Bund Spread
French consumer prices rose 3.0% YoY in September 2026, up from 2.4% in August and the highest reading since February 2024, according to the INSEE flash estimate of 30 September. The drivers behind that rise were already visible in our model before the release. In our...
Macroeconomic Insights: France CPI, Energy and the OAT-Bund Spread
French consumer prices rose 3.0% YoY in September 2026, up from 2.4% in August and the highest reading since February 2024, according to the INSEE flash estimate of 30 September. The drivers behind that rise were already visible in our model before the release. In our 25 September run, the Turnleaf Fuel Proxy Basket was the largest single upward contribution to the September estimate, and our food price indices were running well above their usual pace. Wider French bond spreads, meanwhile, highlighted mounting fiscal and political risks.
The official breakdown matched those signals. Energy prices rose 21.2% YoY, up from 16.7%, on higher fuel and gas costs. With a 7.64% weight in the CPI basket, energy accounted for roughly 1.6pp of the 3.0% headline rate and about 0.34pp of the acceleration from August. Fresh food prices rose 9.9% YoY, up from 5.9%. Services, at 51.95% of the basket, rose to 2.2% YoY as the usual September fall in hotel and travel prices was smaller than a year earlier.
How the Shock Travelled Through Our Data
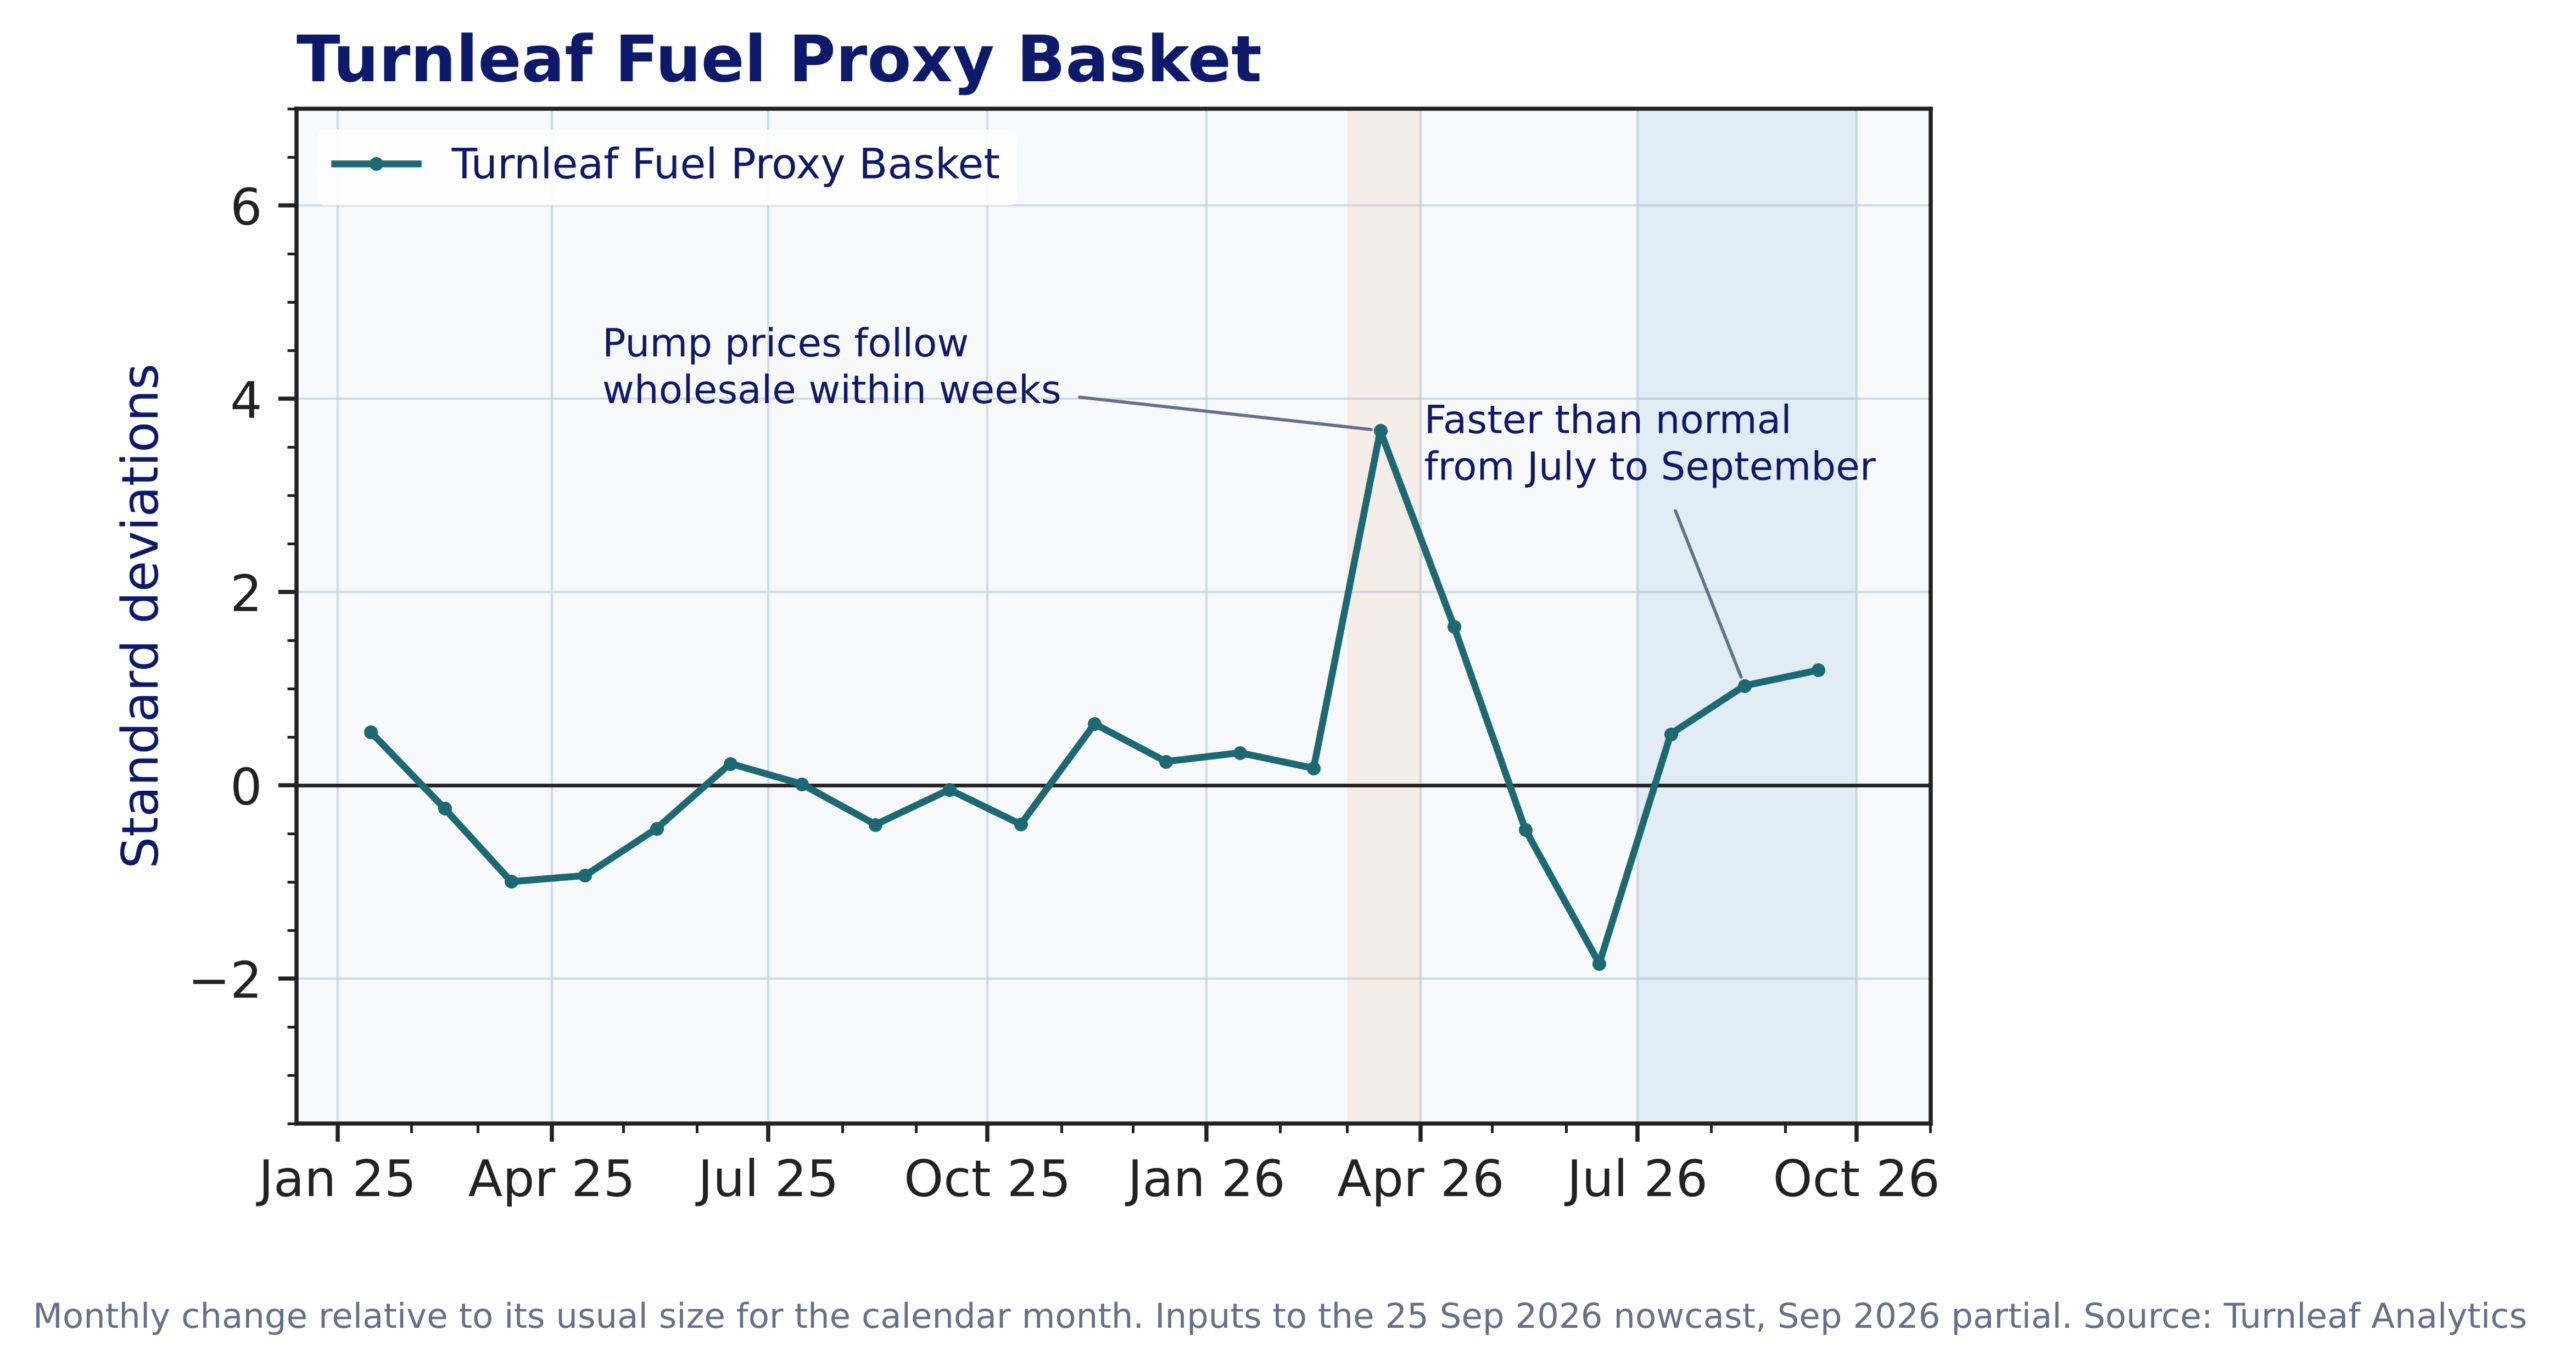
Twice this year, a jump in crude oil has reached French pump prices within weeks, and both times our Turnleaf Fuel Proxy Basket captured the move before the official CPI print. In March, pump prices rose in the same month as Brent. From July to September they rose faster than normal in each month. By the time of our 25 September nowcast, our data had captured that rise.
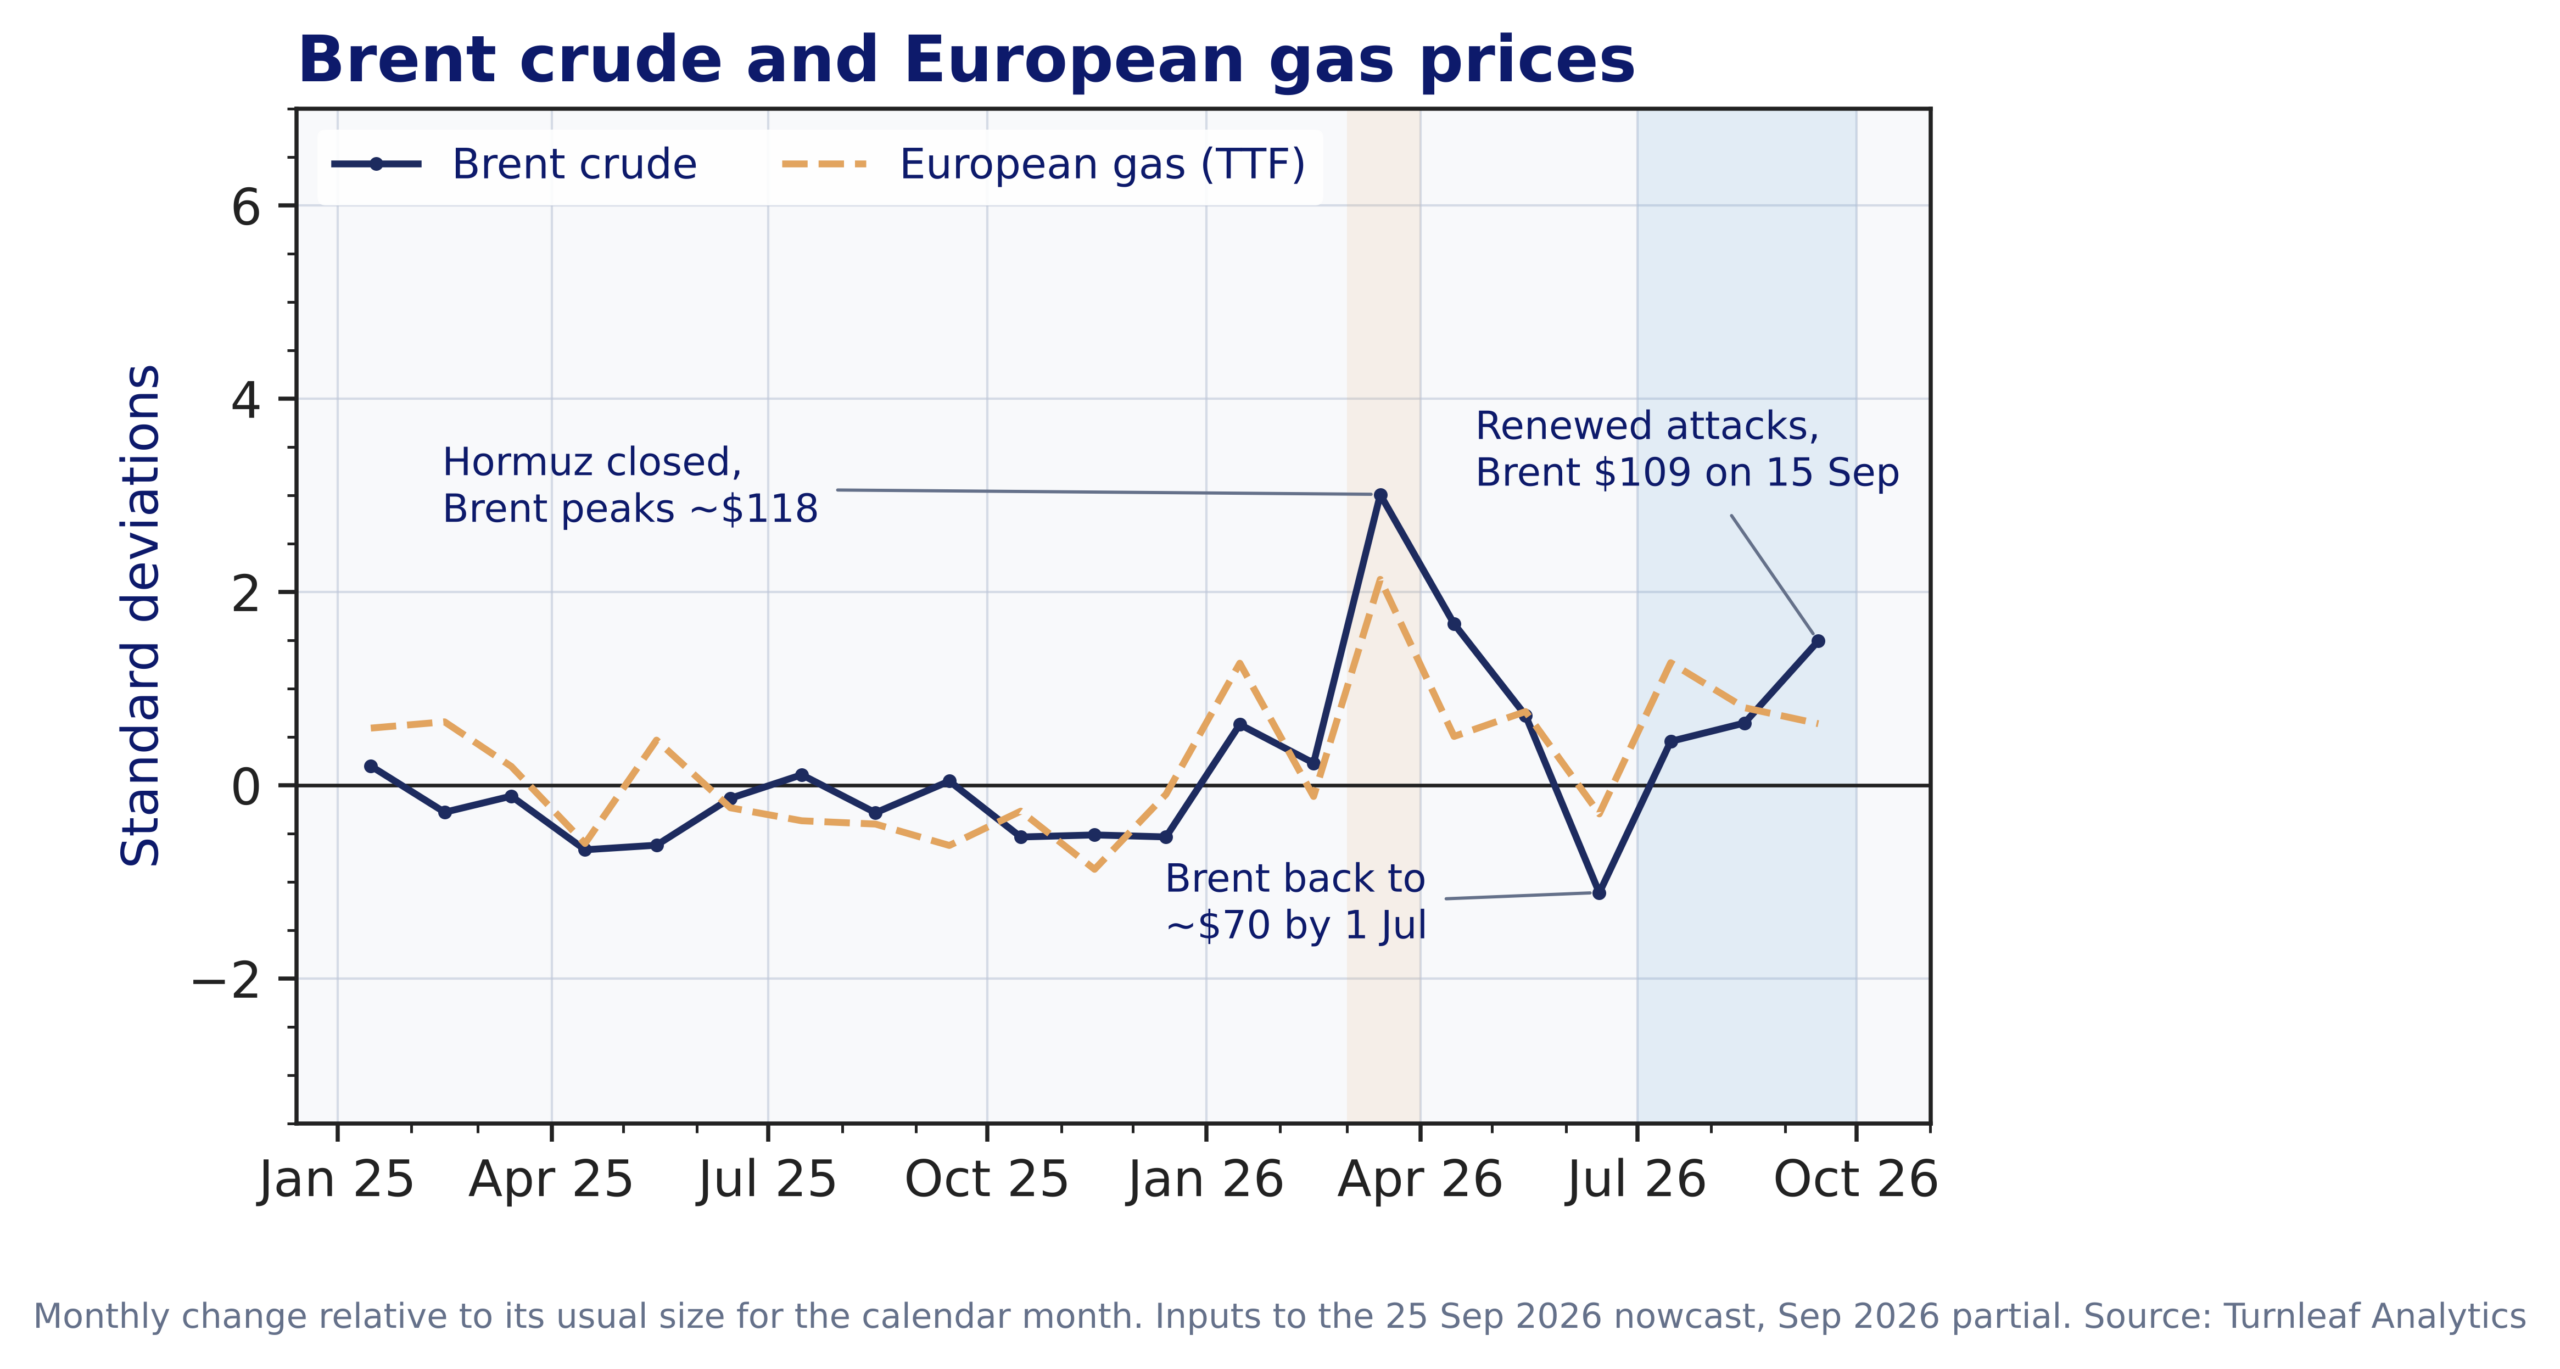
Both rises began in the oil market. The Strait of Hormuz was closed from late February, and Brent peaked at about $118 a barrel in late March as Qatari gas exports also stopped. After the 8 April ceasefire, Brent drifted back to about $70 by 1 July. The second round began with US strikes on Iran on 8 July. Brent futures rose above $100 later that month, traded between roughly $79 and $98 until early September, and reached $109 on 15 September after renewed attacks on tankers and energy sites (Figure 1).
Figure 1. Monthly change in Brent crude and European gas prices, January 2025 to September 2026. Each series shows the monthly price change in standard deviations from its usual change for that calendar month, estimated over a rolling ten-year window, so a negative value means a smaller rise than usual and not necessarily a fall. Data as available for our 25 September 2026 nowcast, with September readings covering the month to that date.
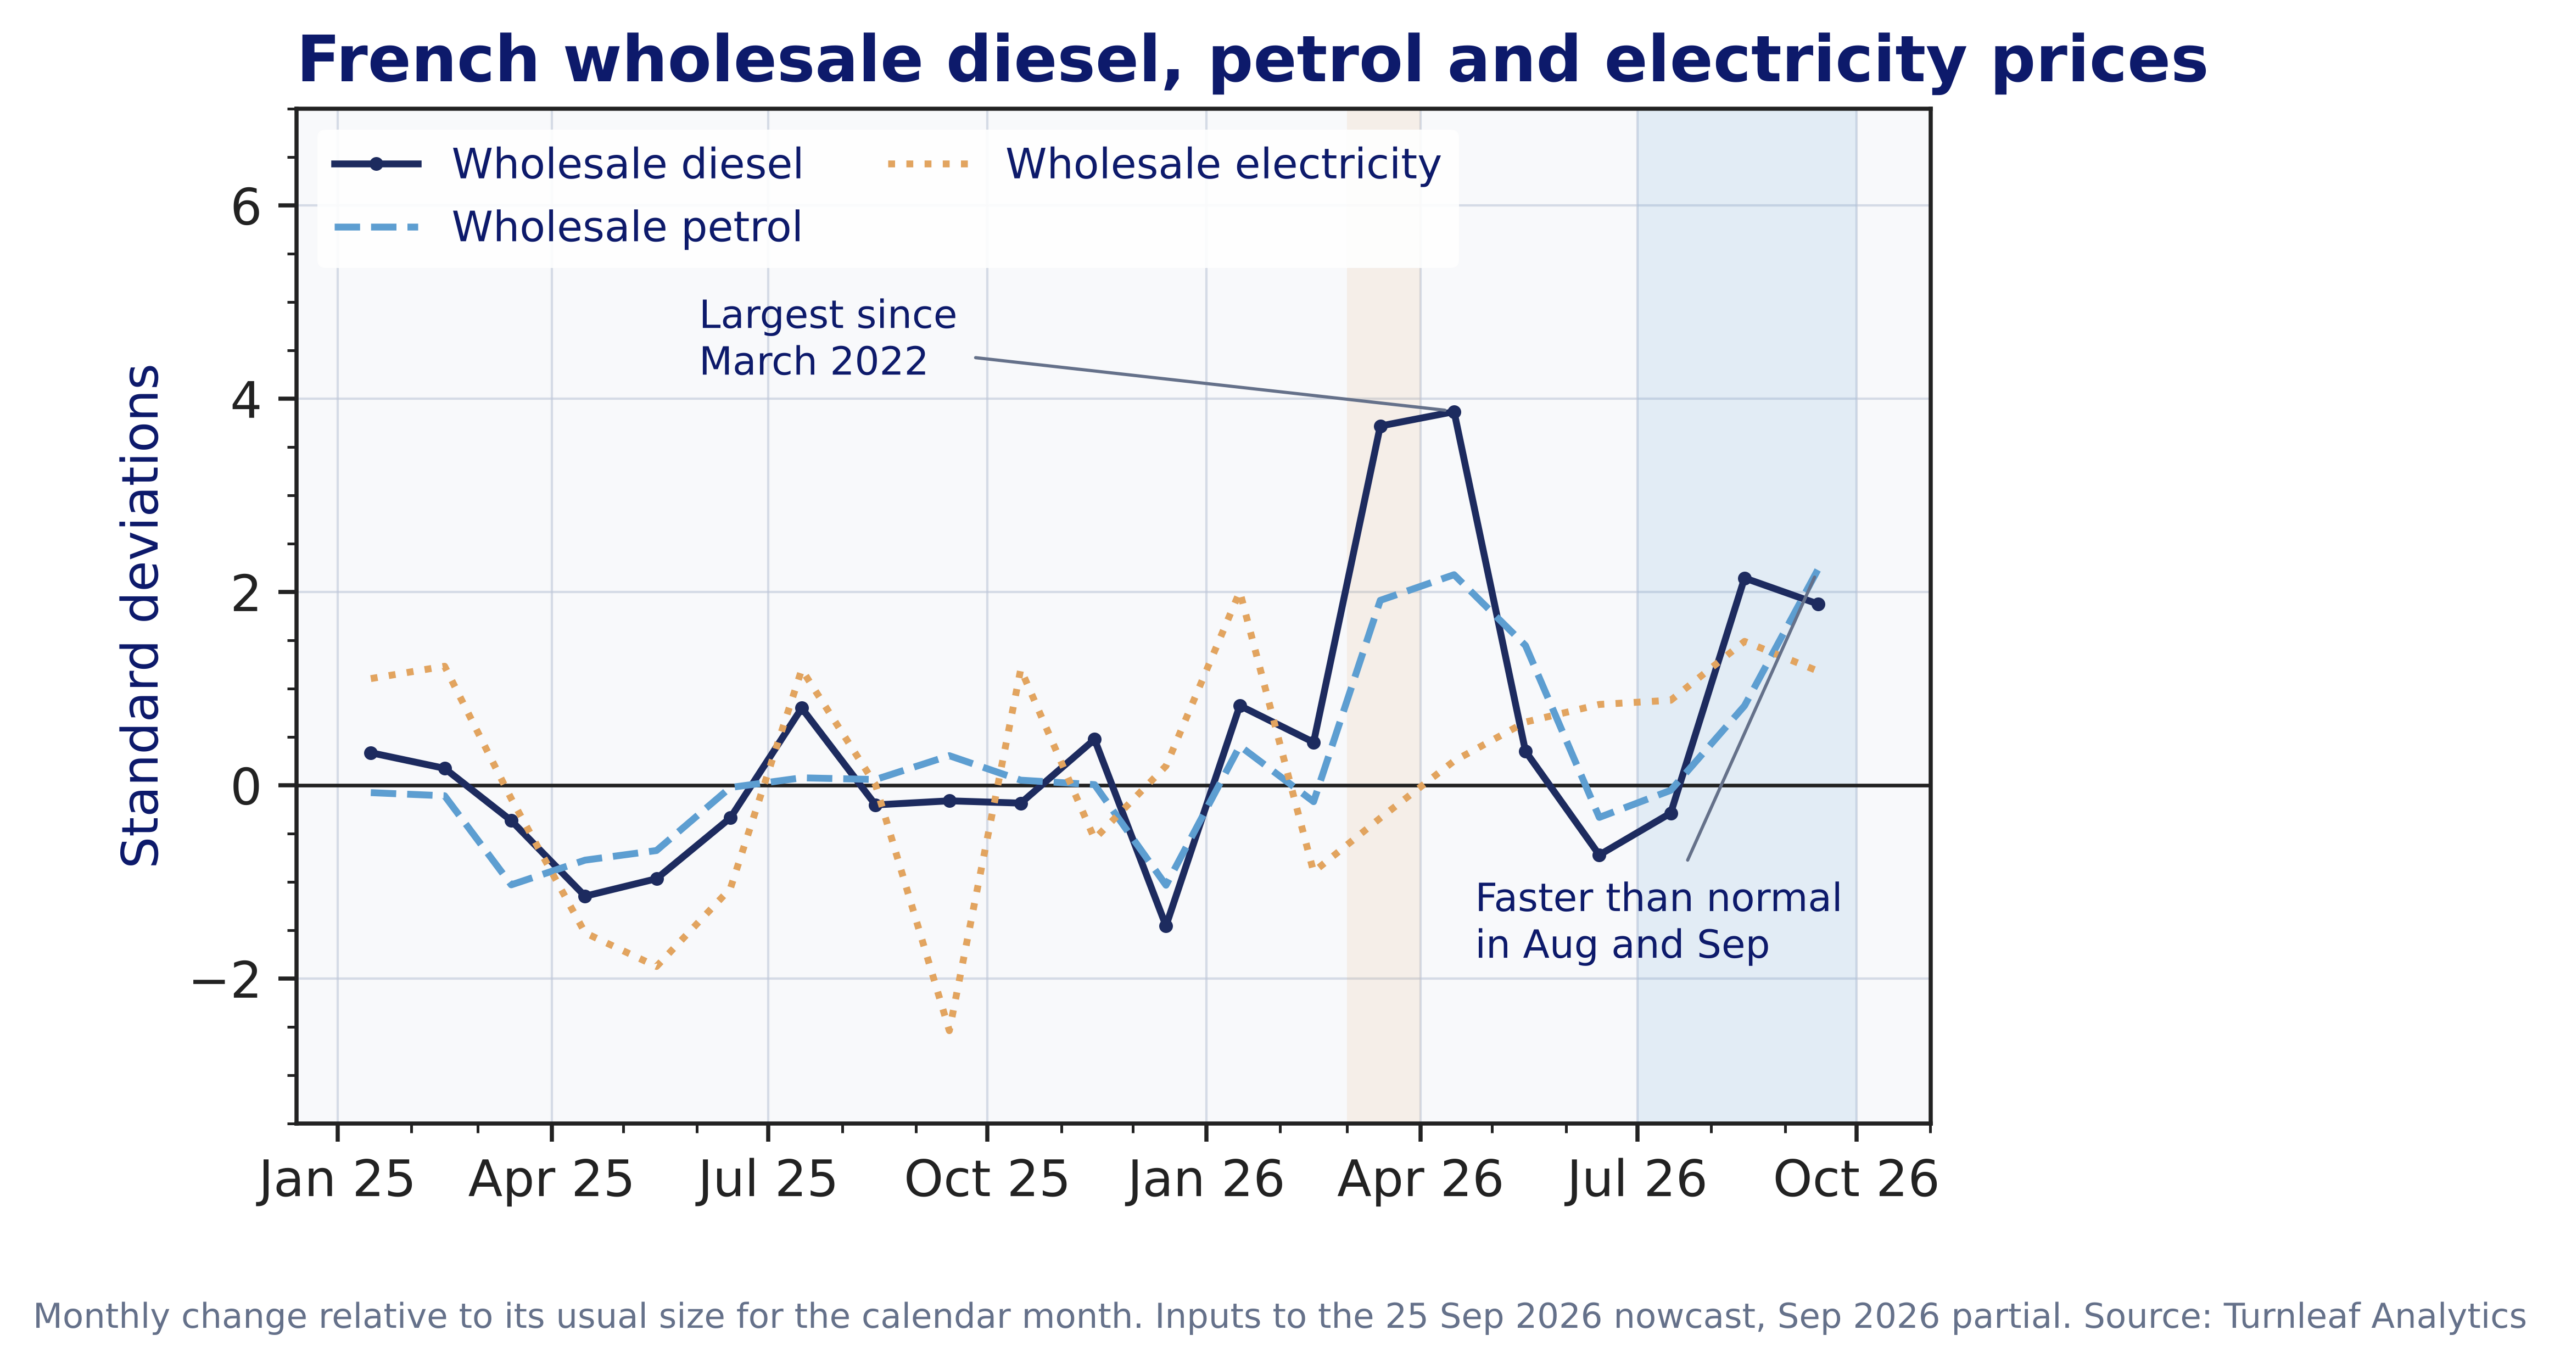
Wholesale fuel moves were more unusual than those in crude. In March and April, the monthly rises in wholesale diesel were the most unusual since March 2022. In the summer, refining outages in Russia, China and the Middle East pushed the margin earned on turning crude into diesel to almost three times its level a year earlier, according to the US Energy Information Administration. Our wholesale diesel and petrol series rose faster than normal in August and September. French wholesale electricity also climbed through the summer (Figure 2).
Figure 2. Monthly change in French wholesale diesel, petrol and electricity prices, January 2025 to September 2026. Each series shows the monthly price change in standard deviations from its usual change for that calendar month, estimated over a rolling ten-year window, so a negative value means a smaller rise than usual and not necessarily a fall. Data as available for our 25 September 2026 nowcast, with September readings covering the month to that date.
Retail fuel prices typically follow wholesale prices within one to two weeks, and our Turnleaf Fuel Proxy Basket tracked both rounds closely. It jumped in March, ran below its normal monthly pace in May and June after the ceasefire, then rose faster than normal in each month from July to September, with the largest moves in August and September (Figure 3). The national average diesel price went from €2.222 a litre on 31 August to €2.415 on 21 September, a rise of almost 9% in three weeks. The 25 September run of our model already included nearly all of that increase.
Figure 3. Monthly change in the Turnleaf Fuel Proxy Basket, January 2025 to September 2026. Each series shows the monthly price change in standard deviations from its usual change for that calendar month, estimated over a rolling ten-year window, so a negative value means a smaller rise than usual and not necessarily a fall. Data as available for our 25 September 2026 nowcast, with September readings covering the month to that date.
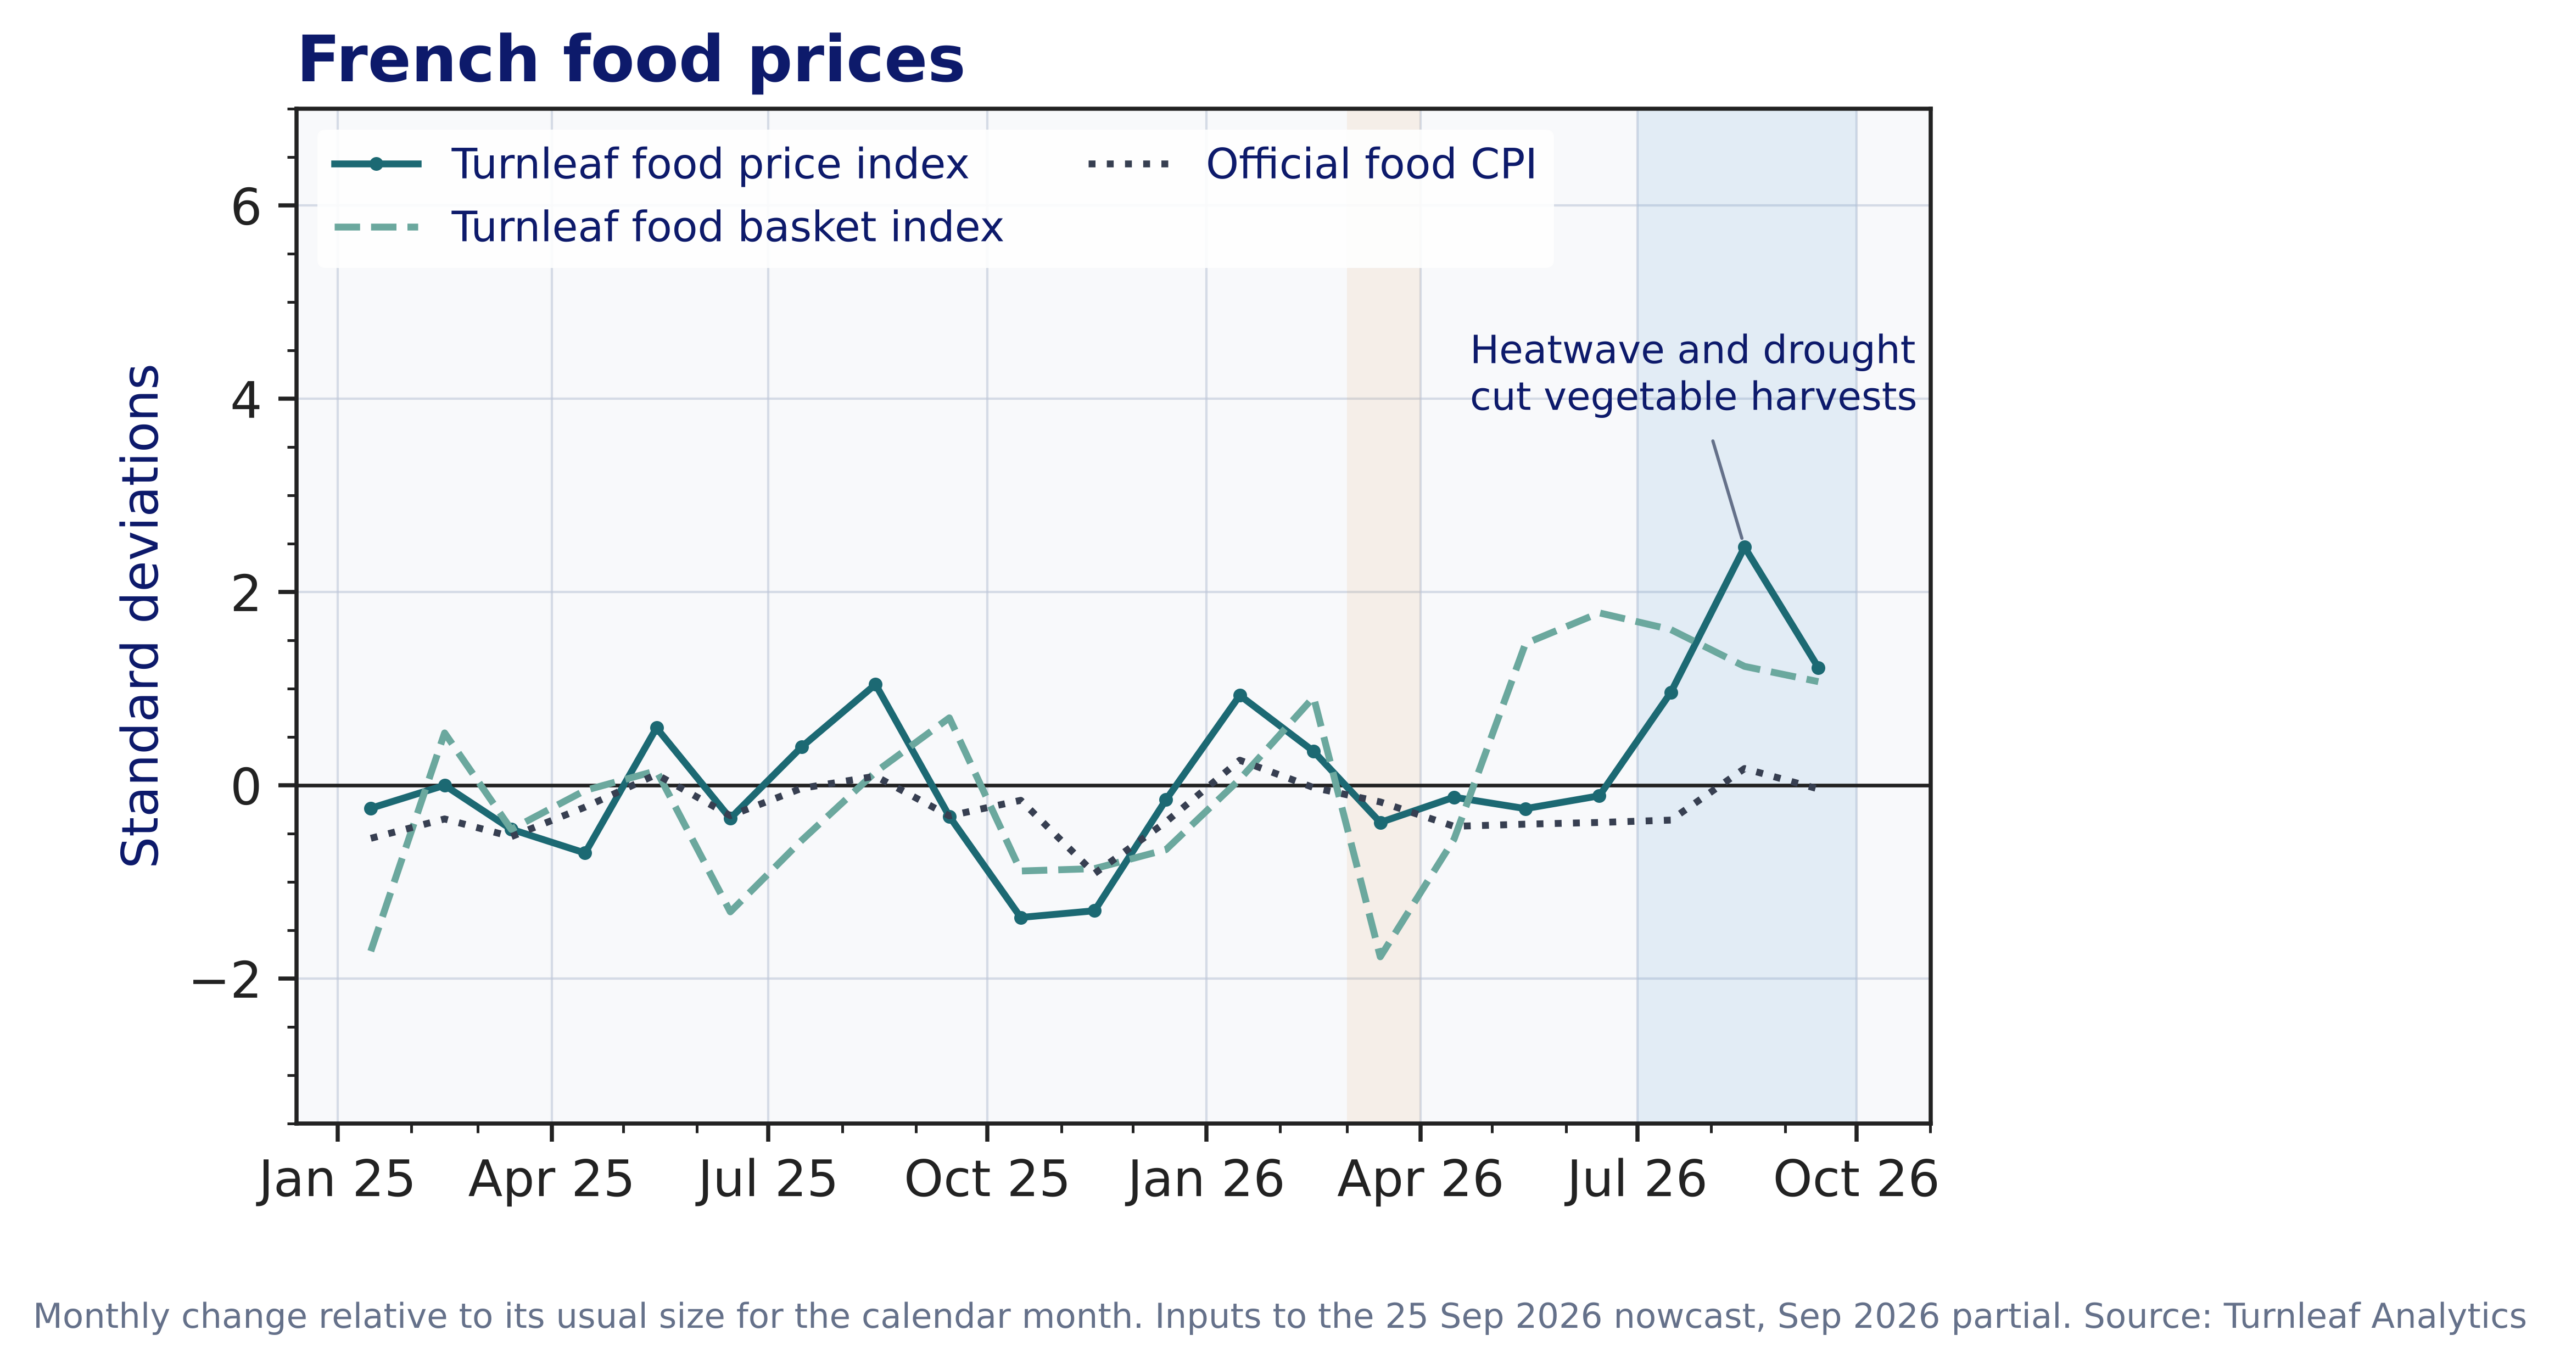
Food followed a separate path to the same outcome. A summer of heatwaves and drought cut harvests, with losses of 20% to 30% on carrots and onions and up to 50% on beans and leeks. At Rungis, the main wholesale fresh food market serving Paris, prices for seasonal vegetables were 17% higher in August than a year earlier, and higher fuel prices raised the cost of transporting produce, particularly imports flown in by air. Our food basket index has been rising faster than usual since May, and our wider food price index posted its biggest move of the year in August. The official food CPI showed no unusual monthly moves over the same period, until fresh food prices showed up in September (Figure 4).
Figure 4. Monthly change in Turnleaf food price indices and the official food CPI, January 2025 to September 2026. Each series shows the monthly price change in standard deviations from its usual change for that calendar month, estimated over a rolling ten-year window, so a negative value means a smaller rise than usual and not necessarily a fall. Data as available for our 25 September 2026 nowcast, with September readings covering the month to that date.
Market pricing had not caught up with these moves by the time of our nowcast. When energy drives inflation, our daily price data tend to pick up the move several weeks before inflation markets do. That lead is what allowed our price data to flag the upside before the release.
The OAT-Bund Spread Is a Fiscal Signal
French bond markets sent a separate signal in the same week. The gap between 10-year French and German government bond yields widened from 80.4bp on 31 August to 105.4bp on 25 September, the day of our nowcast. It reached 146.9bp on 2 October, after the 2027 budget was presented, and stood at 139.5bp on 12 October, with the French 10-year yield at 4.86% against 3.46% in Germany (Figure 5). Market commentary describes this as the widest gap since the 2012 euro area debt crisis. In our model, the French 6-year government yield was further above its usual level than any other input to the September nowcast.
Figure 5. Gap between 10-year French and German government bond yields, 27 August to 12 October 2026.
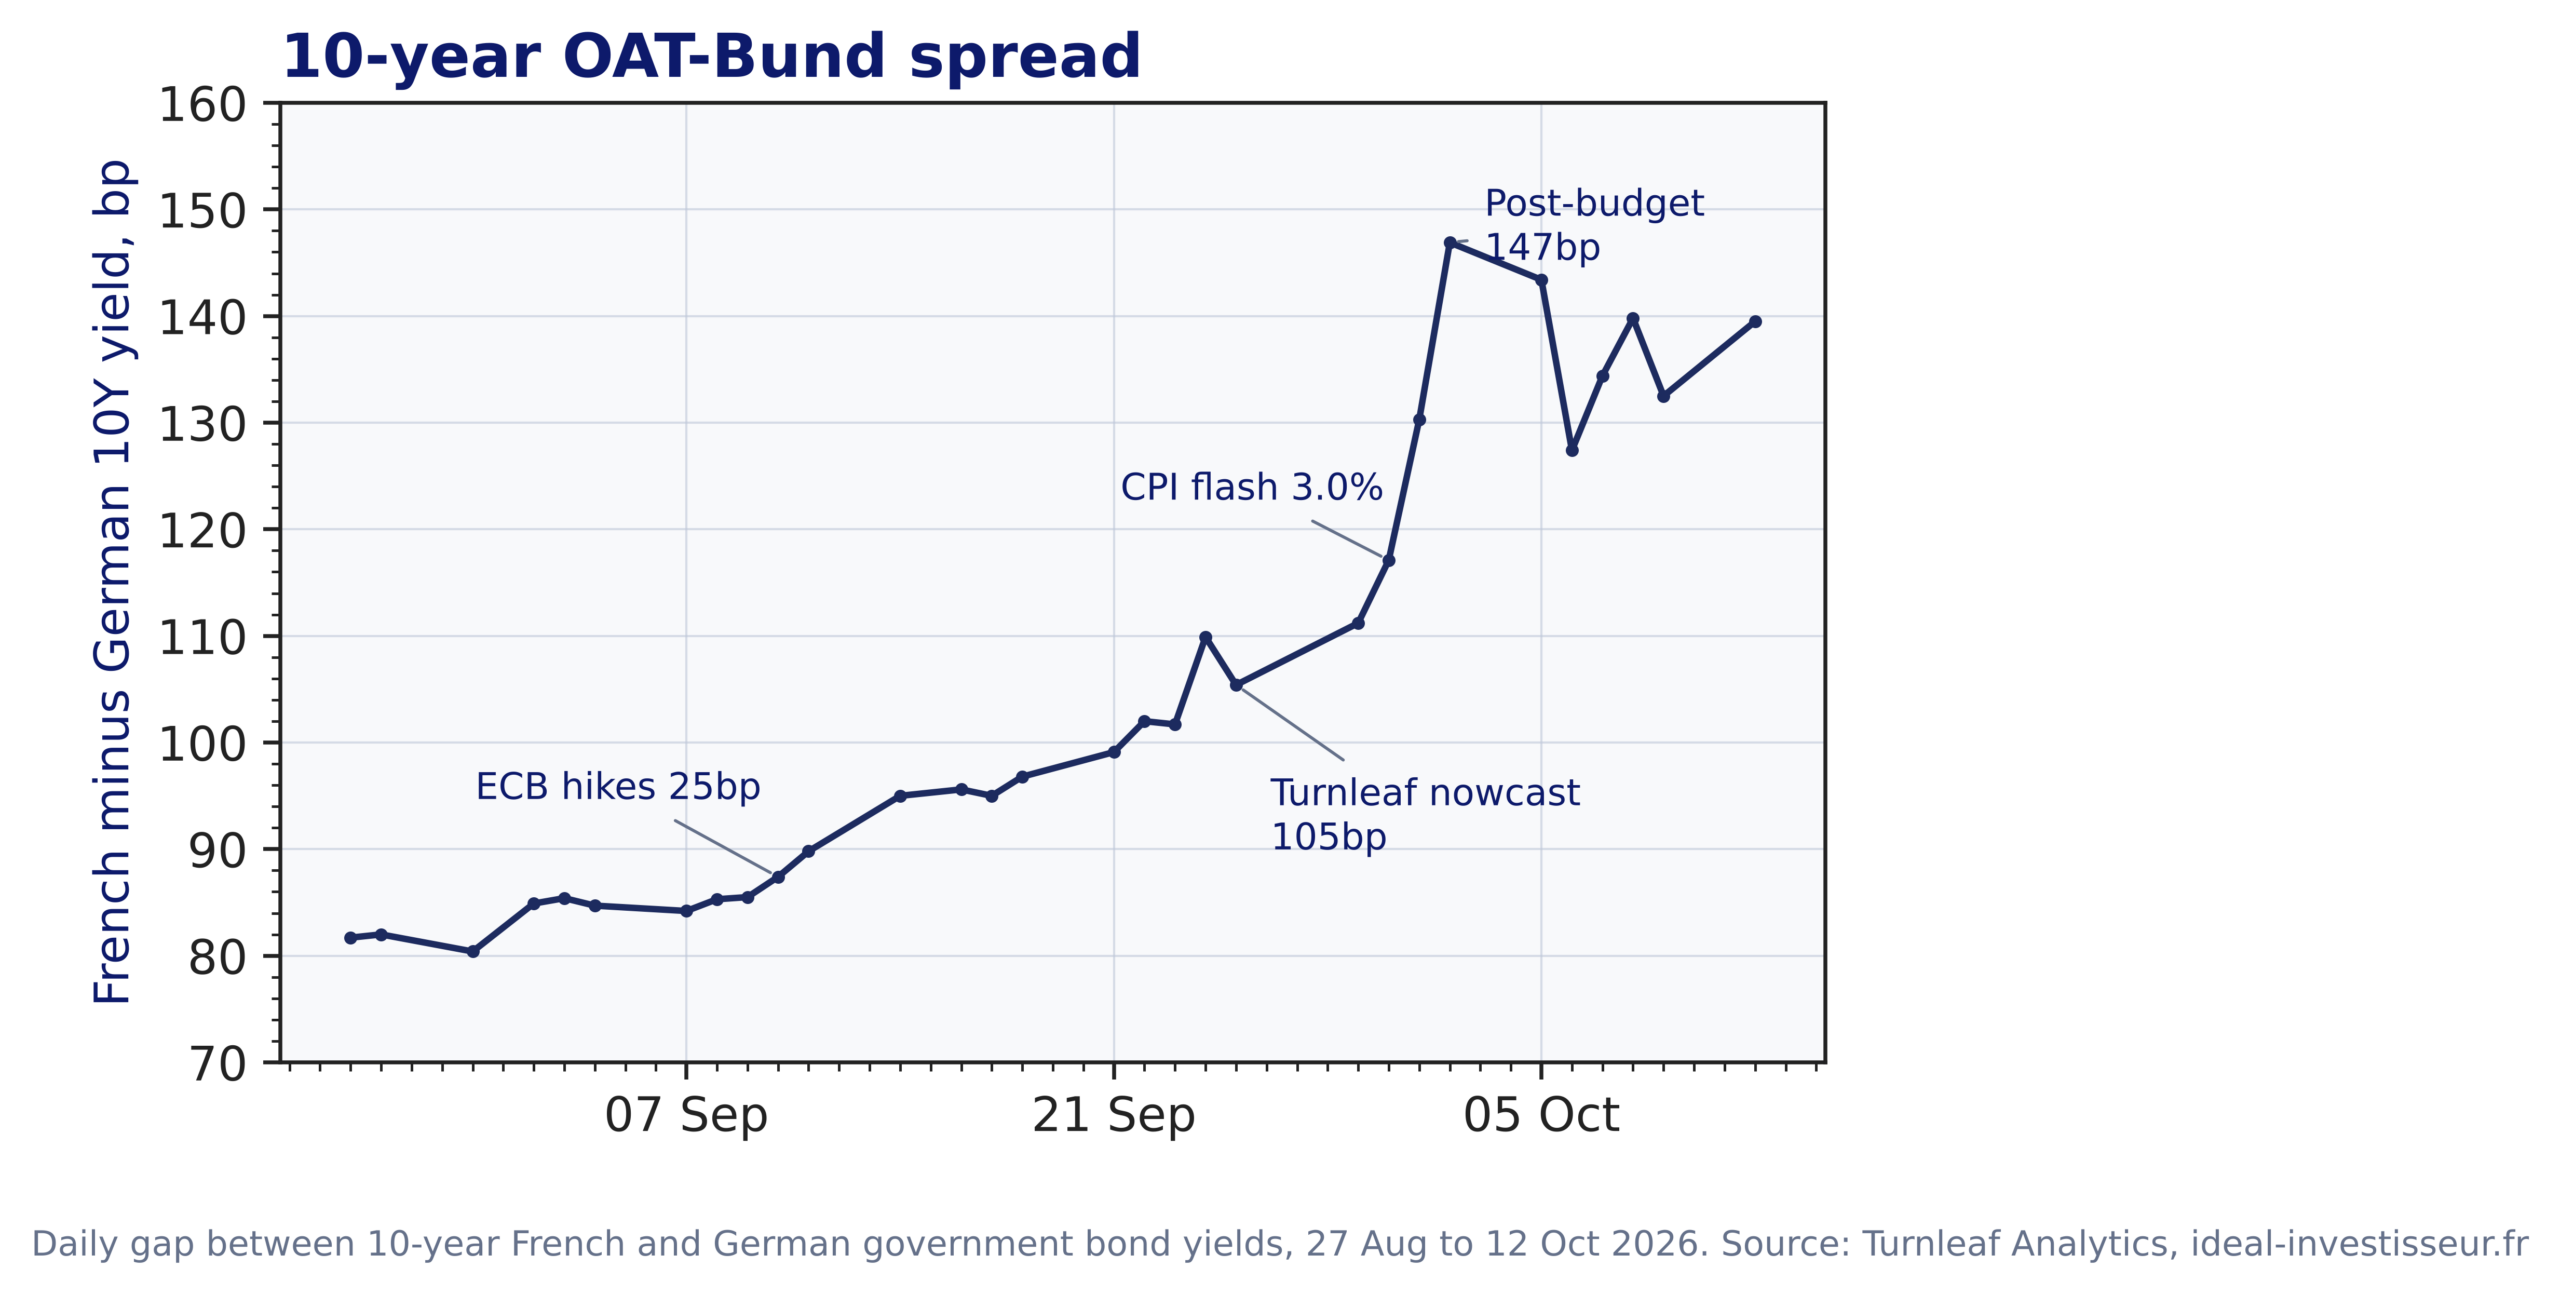
The widening reflects France’s public finances and politics. Investors are pricing the risk that France cannot deliver the consolidation it has promised. The 2027 budget unveiled on 1 October relies on €43 billion of savings to bring the deficit down to 5% of GDP from 5.4% in 2026, yet public debt is still projected to reach 121.7% of GDP. Prime Minister Sébastien Lecornu needs a divided parliament to pass it, two of his predecessors fell trying to do the same, and presidential elections in April and May 2027 leave little room for further cuts. On the harmonised measure used for cross-country comparison, German inflation reached 3.3%, close to France’s 3.4%, and both countries face the same European Central Bank (ECB) policy after its 25bp rate rise on 10 September took the deposit rate to 2.50%. With inflation and monetary policy broadly shared, the extra yield on French debt points to French fiscal and political risk.
Higher borrowing costs and the ECB rate rise slow spending, and in our model interest rates and credit together took about 0.03pp off the September estimate. Smaller inflation increases for pensions above €1,260 a month and lower health reimbursements will weigh on household spending from 2027, while VAT receipts are projected to rise by more than €7 billion. Higher inflation has pushed yields up, but across the euro area. In September the 10-year Bund yield rose 27bp while the OAT rose 64bp, and inflation market pricing for France moved up by about 0.1pp for each month from October to January after the 30 September print. With German inflation running at a similar rate, that repricing explains the common rise in yields but not the extra move in France. We read the widening as a France-specific risk premium on debt sustainability and the political path to consolidation. It reaches prices mainly through tighter financing conditions and the fiscal adjustment it forces, and both act with a lag and lean against inflation in 2027.
Turnleaf Outlook
To read the rest of this article, visit our latest Substack post here.
Research Archive
Macroeconomic Insights: France CPI, Energy and the OAT-Bund Spread
French consumer prices rose 3.0% YoY in September 2026, up from 2.4% in August and the highest reading since February 2024, according to the INSEE flash estimate of 30 September....
Takeaways from WBS Training Malta 2026 Conference
Earlier in October I visited Malta. I had never been to Malta, but I found it to be a fascinating place. Sitting in a very strategic location in the Mediterranean, it has been...
Macroeconomic Insights: Turnleaf’s March Inflation Path and Where Bond Yields Landed in September 2026
With September inflation data now arriving, we can compare the realised outcomes with forecasts made at the end of March, a few weeks into the conflict with Iran. Our forecasts...
Macroeconomic Insights: From Refining Margins to Inflation
Euro area inflation rose to 3.2% YoY in August from 2.9% in July, with energy contributing 1.29 percentage points to the annual rate, according to Eurostat. The ECB's September...
Macroeconomic Insights: Where Are Airfares Headed?
US airline fares rose 2.7% in August on a seasonally adjusted basis and were 23.4% higher than a year earlier before adjustment. The increase was one of the services components...
Macroeconomic Insights: The 2026 Food Shock Has Repriced Inputs, Not Baskets
Six months after Iran began blocking the Strait of Hormuz on 28 February 2026, the cost of many of the inputs that feed into food production has risen sharply, yet consumer food...
Macroeconomic Insights: Poland August 2026 CPI, Fuel Taxation and the Grains Channel
Poland's flash CPI for August 2026 printed at 3.4% YoY, up from 3.0% in July and 2.5% in June. Turnleaf's 1 September 2026 forecast holds headline inflation above 4% YoY from the...
Macroeconomic Insights: Why China’s Cost Shock Never Reached Consumers
Chinese headline CPI rose 0.5% YoY in July 2026, with core inflation at 0.9%, leaving the January to July average at just 0.9% against an official target of around 2%. The food,...
Macroeconomic Insights: What Will Move US CPI? Debt, Tariffs and Container Contracts
US headline CPI printed 3.4% YoY in July 2026 with core at 2.5%, a second consecutive deceleration from the 4.2% peak in May. This morning's PCE release for the same month ran...
Macroeconomic Insights: Hormuz, El Niño and Apparel Inflation
Commercial traffic through the Strait of Hormuz has been severely disrupted since 28 February 2026 and has not meaningfully normalised. Lloyd's List Intelligence counted just 73...
Macroeconomic Insights: The Next Inflation Risk for the Eurozone Is Natural Gas
Euro area annual inflation rose to 2.9% YoY in July 2026 from 2.8% in June, confirmed in Eurostat's final release, driven by a renewed acceleration in energy inflation to 10.3%...
Macroeconomic Insights: Nowcasting APAC Through the Hormuz Shock
No region sits closer to the February 2026 closure of the Strait of Hormuz than Asia. On Energy Information Administration (EIA) estimates, roughly four fifths of the crude that...
What I’ve learnt from 13 years of working independently
It’s been exactly 13 years since I quit my last “proper” job at Nomura in FX to work independently, culminating in cofounding Turnleaf Analytics with Alexander Denev a few years...
Macroeconomic Insights: LATAM – One Oil Shock, Six Reactions
The 2026 oil shock has affected inflation very differently across Latin America. The same increase in global energy costs has passed through six different domestic transmission...
Macroeconomic Insights: CEE’s Deferred Inflation Pass-Through
The closure of the Strait of Hormuz and the wider conflict involving Iran pushed regional fuel and gas costs sharply higher from March 2026. Governments across Central and...