On April 17, markets briefly priced in peace. Iran had declared the Strait of Hormuz open, a Lebanon ceasefire had just started, and WTI dropped 6% in a day. Prediction markets gave a 97% chance the war would be over by December. The futures strip was falling toward the pre-war $67 level.
A month later, almost all of that optimism has unwound. Iran attacked three ships on April 22, days after declaring the Strait open. The US blockade continues with ongoing tanker seizures. The Trump-Xi summit produced nothing on Hormuz. A UAE nuclear facility was hit over the weekend. The Strait is effectively closed, with only 16 vessels transiting per day against a pre-war baseline of 60. The IEA has warned that the oil market will remain undersupplied through October even if fighting ends next month.
Figure 1 shows how the outlook has shifted. The top panel plots the cumulative probability of the war having durably ended (defined as 14 consecutive days without military action) by each date through December 2026, aggregated across four prediction market platforms. The grey dashed line is the curve as it stood on April 17. The orange line is where it sits today. The gap between them is the optimism that has been repriced out since mid-April. The June bucket dropped 30 percentage points from 65% to 35%, December fell 17 points from 97% to 80%. The market has pushed the expected resolution window out by roughly two to three months: where traders in April thought the war would most likely end between May and July, they now see August to October as the more probable window.
Figure 1
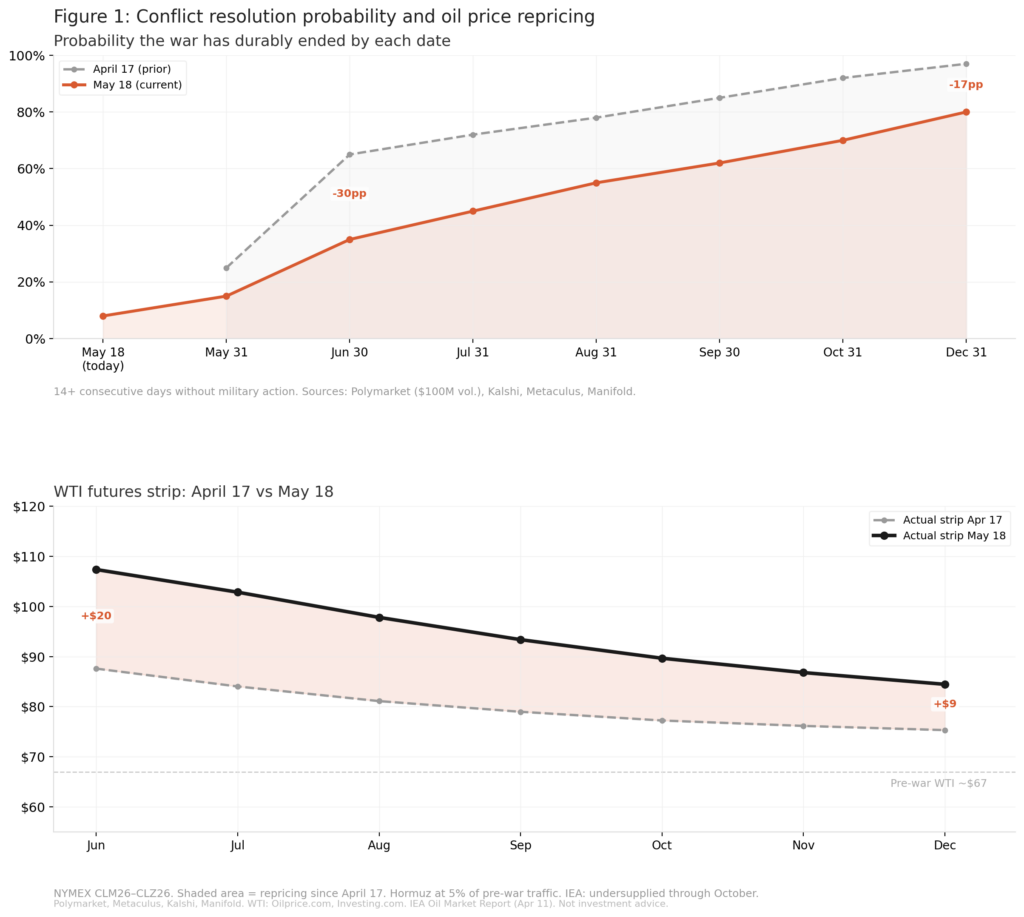
The bottom panel of Figure 1 translates this shift into oil prices. The dark line is the actual WTI futures strip as of today, from $107 for the June contract down to $84 for December. The grey dashed line is the strip from April 17 for comparison, and the red shading between them shows the magnitude of the repricing. The front end moved up $20 and the back end $9 over the past month. In mid-April, the strip was converging toward the pre-war $67 baseline. Today it sits $17-40 above it across the entire curve.
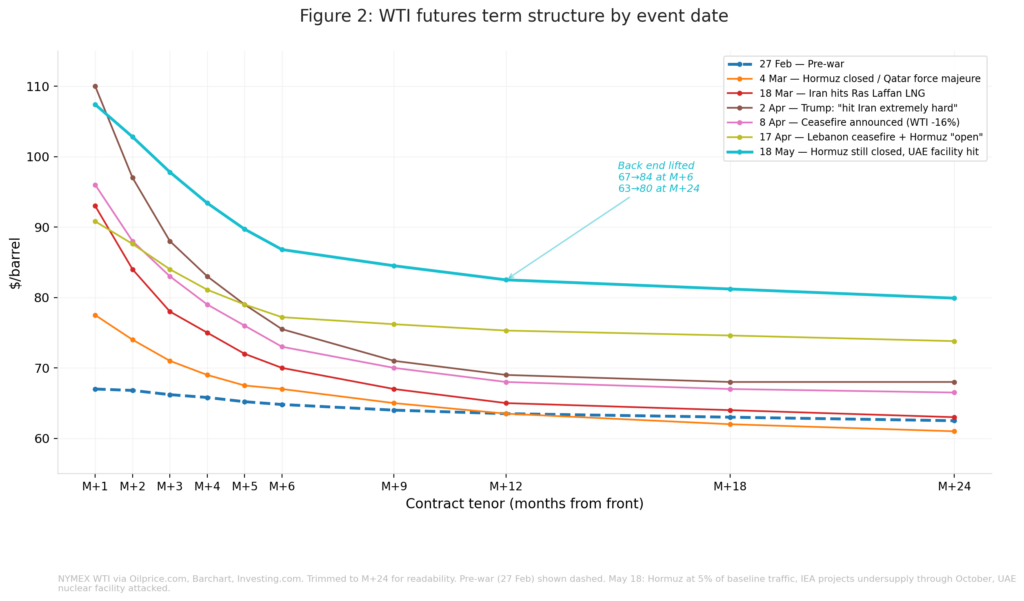
Figure 2 provides the longer view. It plots the WTI futures curve at seven key event dates since the war began on February 28, with each line showing the price at every contract tenor from front-month out to two years. The pre-war baseline (dashed blue, February 27) was nearly flat at $67. Each escalation pushed the front end up while the back end barely moved, producing steep backwardation. Each de-escalation pulled the front end back down. The critical change visible in today’s curve (cyan) relative to our April snapshots is the back end. The M+6 contract has moved from $67 pre-war to $84 today. The M+24 contract has moved from $62 to $80. When the back end of the curve lifts, the market is no longer treating this purely as a temporary disruption. Some structural repricing of the expected duration is occurring.
Figure 2