
Featured Research
Macroeconomic Insights: LATAM – One Oil Shock, Six Reactions
The 2026 oil shock has affected inflation very differently across Latin America. The same increase in global energy costs has passed through six different domestic transmission mechanisms (Figure 1). That divergence is already visible in the latest data. Headline...
Macroeconomic Insights: LATAM – One Oil Shock, Six Reactions
The 2026 oil shock has affected inflation very differently across Latin America. The same increase in global energy costs has passed through six different domestic transmission mechanisms (Figure 1). That divergence is already visible in the latest data. Headline inflation stood at 4.64% YoY in Brazil, 6.14% in Colombia and 33.5% in Argentina in June 2026. The latest July readings were 3.12% in Mexico, 4.07% in Peru and 3.5% in Chile.
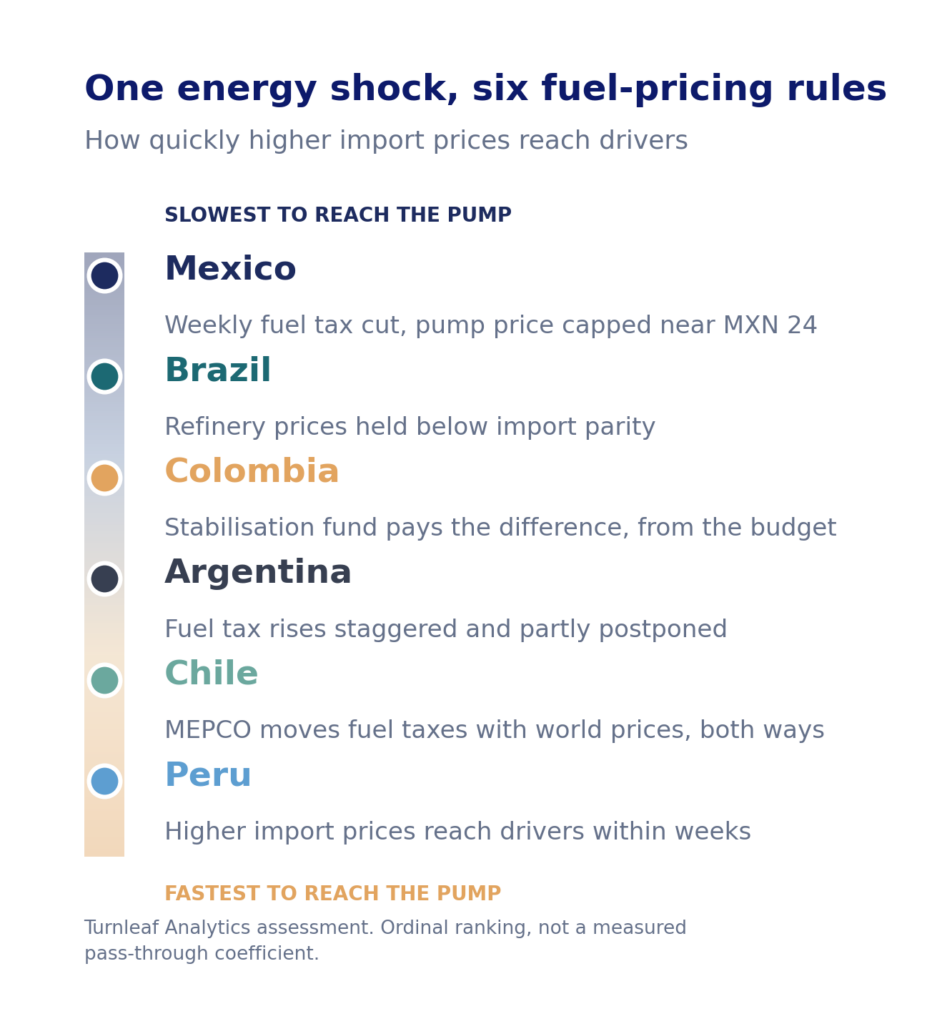
We expect these gaps to narrow over the next 12 months, but the path will depend on wage settlements, fuel-pricing rules and the timing of policy adjustments in each country. Three factors help explain the differences. The first is how quickly higher international energy prices reach the pump. Figure 1 places Mexico at one end, where weekly fuel-tax adjustments limit increases in retail gasoline prices, and Peru at the other, where changes reach consumers within weeks. Chile sits between the two, with its pricing mechanism smoothing both increases and subsequent declines. The second is where inflation pressure remains after the initial energy shock, particularly in fuel, wages or services. The third is whether currencies, food prices and the developing El Niño add to or reduce those pressures over the coming year.
Figure 1. One energy shock, six fuel-pricing rules. Ordinal ranking of how quickly international fuel-price changes reach the pump, based on a Turnleaf Analytics assessment rather than a measured pass-through coefficient.
Brazil
Figure 2. Brazil CPI inflation, YoY NSA. Realised data and successive Turnleaf forecast vintages from 26 June to 6 August 2026.
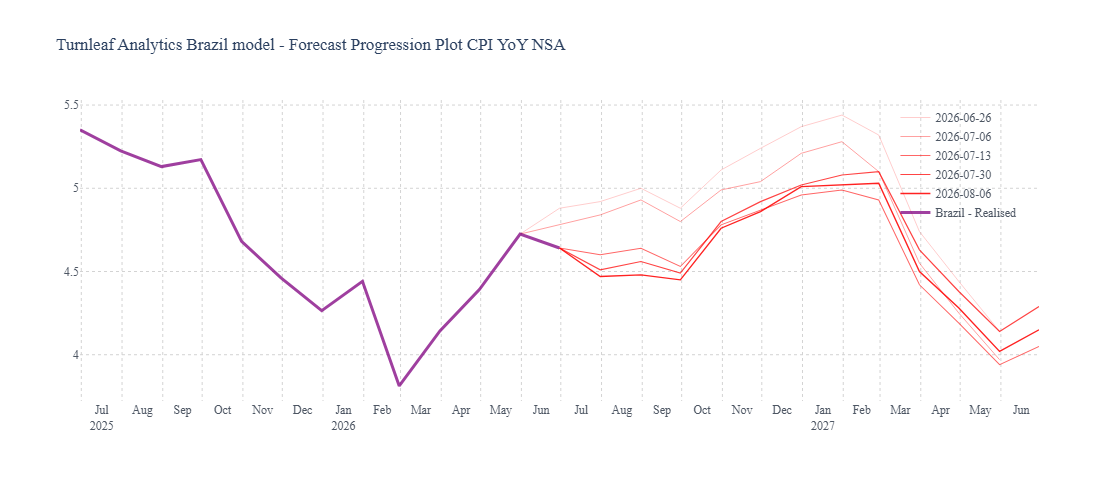
Brazilian inflation is likely to remain above the 3% central target through 2027, with diesel, freight and food costs slowing the decline (Figure 2). Energy inflation has risen faster than headline inflation, but retail fuel prices have adjusted more slowly than international crude. Petrobras has kept refinery prices below import parity, limiting the increase passed on to distributors. The higher ethanol blend reduces how much gasoline prices move with crude, while lower taxes on imported diesel offset part of the increase in import costs.
Diesel remains the main source of pressure. Brazil imports diesel to cover demand that domestic refineries cannot meet, so higher international prices feed into freight, farm costs and distribution. Gasoline, unlike diesel, gets an additional buffer from ethanol. Fertiliser adds another channel, with higher input costs reaching food prices later through agricultural production. The latest Focus survey, dated 31 July, placed market expectations at 5.03% for 2026 and 4.22% for 2027. The Banco Central do Brasil’s June reference scenario projected inflation at 3.7% in the fourth quarter of 2027, above the 3% central target although inside the 1.5 percentage point tolerance band. Diesel, freight and food costs could therefore keep inflation above the central target after the initial rise in energy prices fades.
Another rise in oil prices would increase diesel costs first and feed into transport and production costs. Higher urea and other fertiliser prices would reach food with a longer lag. El Niño adds uncertainty to the food outlook. Drought risk is higher in northern Brazil, including coffee-growing regions, while heavier rainfall may support grain production farther south. Lower oil prices and softer food inflation would bring inflation down faster. A weaker real would raise the local cost of imported diesel and fertiliser and keep freight and food inflation elevated for longer.
Argentina
Figure 3. Argentina CPI inflation, YoY NSA. Realised data and successive Turnleaf forecast vintages from 13 March to 15 July 2026. (to gain access to the forecast, visit our latest Substack post, here)
Argentine inflation should keep falling through 2027 while monthly prints remain around 2% in the near term (Figure 3). The annual rate is the highest of the six, and it is also falling fastest. Headline inflation slowed to 1.9% MoM in June and 33.5% YoY, while core inflation also rose 1.9% on the month. The BCRA’s July market survey placed expected inflation over the next 12 months at 21.8%, down from 22.3% in the previous survey. It also put year-end inflation at 29.8% for 2026 and 20.0% for 2027. The difference between the current 33.5% annual rate and the 21.8% 12-month expectation partly reflects the high 2025 readings still sitting in the annual comparison, and partly the lower monthly rates expected over the year ahead.
The exchange-rate band, the fuel-tax calendar and utility tariffs set the pace of Argentine inflation. Fuel prices have continued to rise, although tax increases have been staggered and parts of the adjustment have been postponed. Producers have also used temporary price freezes to slow increases at the pump. The exchange-rate band remains linked to recent inflation, which limits the speed of currency adjustment. If monthly inflation stays close to 2%, the YoY rate will continue to fall as higher inflation readings from 2025 drop out of the comparison. A simultaneous increase in fuel taxes, utility tariffs and the exchange rate would slow that decline.
Agriculture creates an additional channel. Higher energy and fertiliser prices increase production costs, but stronger export prices can support farm income and foreign-currency earnings. El Niño could also improve rainfall across parts of the southern grain belt, supporting crop production. Inflation would fall more slowly if the exchange rate and administered prices adjust at the same time. It would fall faster if fuel increases stay inside energy prices and do not reach wages and services.
Colombia
Figure 4. Colombia CPI inflation, YoY NSA. Realised data and successive Turnleaf forecast vintages from 1 June to 5 August 2026. (to gain access to the forecast, visit our latest Substack post, here)
Colombian inflation will likely stay near 6% into 2027. Turnleaf’s 9 June 2026 forecast rises from the high-5% range toward roughly 6.4% to 6.6% around the turn of the year and stays close to that range into spring 2027 (Figure 4). The June data support that path. Headline inflation stood at 6.14%, with food inflation at 6.8%, regulated-price inflation at 5.9% and core inflation excluding food and regulated items at 6.0%. Market expectations were close to 6.6% for December 2026 and 5.0% for the end of 2027.
The next stage of inflation will depend on how quickly wage increases and indexation work through services, regulated charges and contracts. The 2026 minimum-wage increase raises labour costs across service sectors and feeds into prices as contracts and regulated charges reset at different points during the year. This keeps price increases spread across the second half of 2026 and into 2027. Colombia’s stabilisation fund holds pump prices down now and pays the difference from the budget. When that becomes too expensive, pump prices rise later instead. Peso appreciation can help by lowering imported costs, but it does not stop domestic wages and regulated prices from resetting.
This leaves Colombia with a slow path back toward lower inflation. A stronger peso, weaker demand and slower indexation would bring inflation down sooner. Additional increases in fuel prices or regulated charges would extend the period of inflation near 6%. Our forecast assumes the initial oil shock fades, while wage increases, indexed prices and delayed administered-price adjustments continue to shape inflation through 2027.
Peru
Figure 5. Peru CPI inflation, YoY NSA. Realised data and successive Turnleaf forecast vintages from 18 June to 4 August 2026.(to gain access to the forecast, visit our latest Substack post, here)
Peruvian inflation should fall back toward the 1% to 3% target band during 2027, provided fuel and electricity prices stop rising. Inflation reached 4.07% in July, above the Central Reserve Bank of Peru’s 1% to 3% target band, which is centred on 2%. The increase followed higher international fuel prices and a domestic gas-pipeline disruption in March, which raised costs across transport, electricity and industrial supply. The government responded through the Fuel Price Stabilisation Fund and other measures, but fuel and electricity prices still rose enough to push headline inflation higher.
Inflation should begin to ease if fuel supply normalises and the increases recorded in 2026 gradually fall out of the annual comparison. This is also the direction reflected in the BCRP’s June projection. That path holds only if fuel increases stay inside energy prices and do not reach wages and services. Our Peru forecast was revised up through the spring as the March disruption fed through, and Figure 5 shows the vintages since June easing back.
Food prices could slow that return toward the target band. Turnleaf’s high-frequency food index rose sharply after March, although that increase came from Peruvian harvests and local supply, not from the Hormuz disruption. El Niño could add further pressure through coastal weather and agricultural supply over the coming months. A combination of higher food, fuel and electricity prices would keep headline inflation elevated for longer. Faster energy normalisation, a stable sol and limited pass-through into core inflation would bring inflation back toward the target band sooner.
Mexico
Figure 6. Mexico CPI inflation, YoY NSA. Realised data and successive Turnleaf forecast vintages from 25 June to 3 August 2026.(to gain access to the forecast, visit our latest Substack post, here)
Mexican inflation will move back above 4% around the turn of 2027, even though the July print is now the lowest of the six. Headline inflation fell to 3.12% from 3.37% in June, while core inflation eased to 3.95% from 4.03%. Consumer prices rose 0.03% on the month and core prices rose 0.23%. The latest release extends the decline in headline inflation, but core inflation remains close to 4%.
Mexico exports crude, so the inflation channel is not a simple imported-oil story. What matters for households is how domestic fuel prices are set. The weekly IEPS fuel stimulus lowers the tax component of retail fuel prices, and the voluntary agreement keeps regular gasoline below MXN 24 per litre. These measures have limited the increase at the pump and kept fuel from adding significantly to headline inflation. The current low headline rate also reflects temporary weakness in fresh food and seasonal electricity tariffs.
Our 10 July 2026 vintage rises back above 4% around the turn of 2027 (Figure 6) and stays above Banxico’s path over most of the horizon. Banxico now expects headline inflation to converge to 3% in the fourth quarter of 2027, later than the second-quarter timing in its previous forecast. The July print makes the near-term starting point lower, but the factors holding headline inflation down are temporary. Fresh food prices fell sharply in June, the seasonal electricity tariff reduction lowers household energy costs through the warm season, and fuel policy has kept the direct pump-price effect contained. The food effect will not repeat indefinitely, and the electricity reduction unwinds in the autumn. Core inflation is still 3.95%, so headline inflation can rise again as those offsets fade. Fuel policy will determine how much gasoline and diesel add to that path.
Chile
Figure 7. Chile CPI inflation, YoY NSA. Realised data and successive Turnleaf forecast vintages from 10 June to 3 August 2026.(to gain access to the forecast, visit our latest Substack post, here)
Chilean inflation has already fallen back toward 3%, and Chile is the first of the six where fuel prices have come back down. Inflation fell from 4.3% YoY in June to 3.5% in July, with prices rising only 0.1% on the month. Transport prices fell 3.5% MoM, including an 8.5% decline in gasoline and a 13.5% decline in diesel. Food prices still rose 0.7% and electricity prices increased 2.4%, limiting the decline in the headline rate. Underlying inflation remains firmer, with the CPI excluding volatile items rising 0.5% MoM and the measure excluding food and energy rising 0.4%, so food, electricity and rents are what now keep Chilean inflation above 3%. Figure 7 shows our Chile forecast being revised down as fuel prices fell.
Fuel prices in Chile adjust through MEPCO, which changes fuel taxes to smooth movements in international prices rather than preventing them from reaching consumers. Chilean pump prices rose within weeks in March and April. In late March, the government temporarily accelerated the adjustment to higher international prices before returning to the standard MEPCO rule. The direction reversed as international fuel prices fell. By June, the government announced reductions of CLP 95 per litre for 93-octane gasoline, CLP 106.7 for 97-octane gasoline and CLP 117.5 for diesel. July’s CPI shows that reversal clearly.
The next few months should therefore keep headline inflation close to its current level if fuel prices remain below their spring peaks. Our latest vintage then has inflation moving back above 4% around the turn of 2027, on the weak monthly prints recorded around the turn of 2026 dropping out of the annual comparison, before falling back toward 3% during the course of that year. The Central Bank of Chile expects inflation to return to around 3% in the second quarter of 2027, and weaker consumption and activity should also limit domestic price increases. The July data still leave some pressure outside fuel. Food, electricity, rents and services continued to rise, and the peso remains another route through which international costs can reach domestic prices. A renewed increase in oil prices would push fuel inflation higher again, while continued fuel declines and softer food inflation would move headline inflation toward 3% sooner.
What We Are Watching
The next stage of inflation across the six economies will depend on three things: how fuel-price support changes, how quickly domestic price pressures fade, and whether food adds a second source of inflation. Brazil, Mexico and Colombia still have policy mechanisms limiting the immediate effect of higher fuel costs on consumers. In Brazil, diesel and fertiliser costs could continue to feed into freight and food despite slower adjustment in gasoline. In Mexico, the autumn reversal of electricity subsidies and the fading of unusually weak food prices will lift headline inflation, while the weekly IEPS determines how much fuel contributes. In Colombia, minimum-wage indexation is still passing through services and regulated prices, and the fuel stabilisation fund leaves scope for later adjustments at the pump.
Peru and Chile are further along in the energy adjustment. Peru has already seen higher fuel, electricity and gas costs reach consumers, so the inflation path now depends on energy prices falling back and food pressures remaining contained. Chile has already seen fuel prices rise and then reverse under MEPCO, leaving food, electricity, rents and services to determine how quickly inflation returns toward target. Argentina follows a different path. Fuel prices matter, but the exchange-rate band, utility tariffs, wage setting and fiscal policy will have a larger influence on whether monthly inflation stays close to 2%.
The common point is that crude prices no longer tell us enough about where inflation goes next. The initial oil shock has already passed through each economy in a different way. From here, the path will depend on how governments adjust fuel taxes and administered prices, how quickly wages and services respond, and whether food and currencies add further pressure. Those domestic mechanisms will determine how quickly inflation converges across the six economies over the next year.
Research Archive
November 2024 Global Inflation Call: Transcript
Global Inflation Amid Trade Uncertainties Good afternoon and welcome to Turnleaf’s global inflation call. For the past month, global inflation expectations have been shaped by...
Takeaways from QuantMinds 2024 in London
Over the past years, the quant industry has changed substantially. My first visit to Global Derivatives was just over a decade ago. At the time, perhaps unsurprisingly, the...
Macroeconomic Insights – Poland’s Fight with External and Domestic Demand
As Poland navigates a complex economic landscape, its rapid growth, fueled by competitive wages and strong manufacturing, faces challenges from both domestic and external...
Takeaways from Web Summit 2024
Think of Lisbon and no doubt it’ll conjure images of explorers setting sail in centuries past across the ocean, the hills that climb across the city, pastel de nata and salted...
Macroeconomic Insights: UK Autumn 2024 Budget and Global Trade Pressures Add to Inflation Challenges
The UK government's Autumn Budget for 2024, introduced on October 30, is designed to enhance public services through increased capital investments, funded by higher taxes along...
Macroeconomic Insights: U.S. Inflation Outlook Under Another Trump Presidency
As U.S. economic conditions continue to evolve, Turnleaf will actively monitor inflation trends and publish regular updates to keep you informed. Our focus remains on leading...
Macroeconomic Insights: Turkey’s Two-Front Fight with Inflation and the Lira
Turkey’s central bank has adopted a stringent monetary policy to combat inflation, a stark departure from previous unorthodox strategies. With borrowing costs now at a benchmark...
Inflation Outlook for Canada in October 2024- Producer Optimism, Consumer Pains
Canada’s inflation outlook is shaped by a complex mix of declining energy costs, rising food prices, and evolving trade dynamics. At Turnleaf Analytics, we’re closely tracking...
How Bad is Too Bad? Japan’s Reckoning with Inflation and New Leadership
Japan’s battle with inflation has become a key issue, reshaping public sentiment and influencing recent election results. With the Liberal Democratic Party (LDP)–Komeito...
Turnleaf’s Inflation Outlook for Brazil: Rising Costs Amid Currency Pressures
Turnleaf’s Brazil’ inflation outlook for the next 12 months has undergone an upward revision, driven by several significant factors. While shipping costs have eased, inflationary...
Turnleaf’s October 2024 Economic Forecast: Deflationary Pressures Persist in China
Turnleaf Analytics’ forecast for YoY NSA CPI published in October 2024 suggests an inflation trajectory expected to remain well below 2% over the coming 12 months. Specifically,...
FILS Europe 2024 Takeaways
Paris is home to many things, the Eiffel Tower, the Arc de Triomphe, burgers (ok, I made that one up!). In recent years, Paris' financial community has grown, and indeed, every...
Don’t look back in hanger steak
I'm currently in the queue for Oasis tickets. Rather than mindlessly watching the counter of people in the queue ahead of me fall (currently 184,984 people), I thought I'd start...
The Olympic spirit for forecasting
The Olympics finally finished, and the Paralympics are about to begin. I managed to go to some of the Olympic football matches in both Lyon (in the photo above) and Nice. The...
Eleven years of independence
Regrets become ever more edged with the passing of time. Recalling a time long gone, when perhaps a decision made, was not the decision you should have made, wastes little more...