Featured Research
Macroeconomic Insights: The Oil Shock Could Spread Beyond Hormuz
The oil shock has entered a more complicated phase. Since late February, when the US and Iran conflict began, shipping through the Strait of Hormuz has been severely restricted, cutting the majority of normal Gulf export flows. That disruption constrained the...
Macroeconomic Insights: The Oil Shock Could Spread Beyond Hormuz
The oil shock has entered a more complicated phase. Since late February, when the US and Iran conflict began, shipping through the Strait of Hormuz has been severely restricted, cutting the majority of normal Gulf export flows. That disruption constrained the principal export route for Saudi Arabia and other Gulf producers, but it did not restrict every route out of the region. Saudi Arabia has been redirecting production through the East-West Pipeline to the Red Sea port of Yanbu, while the United Arab Emirates has continued to load crude at Fujairah, which lies outside Hormuz on the Gulf of Oman. Together these alternative routes offer an estimated 3.5 to 5.5 million barrels per day of spare export capacity (Figure 1), according to IEA estimates.
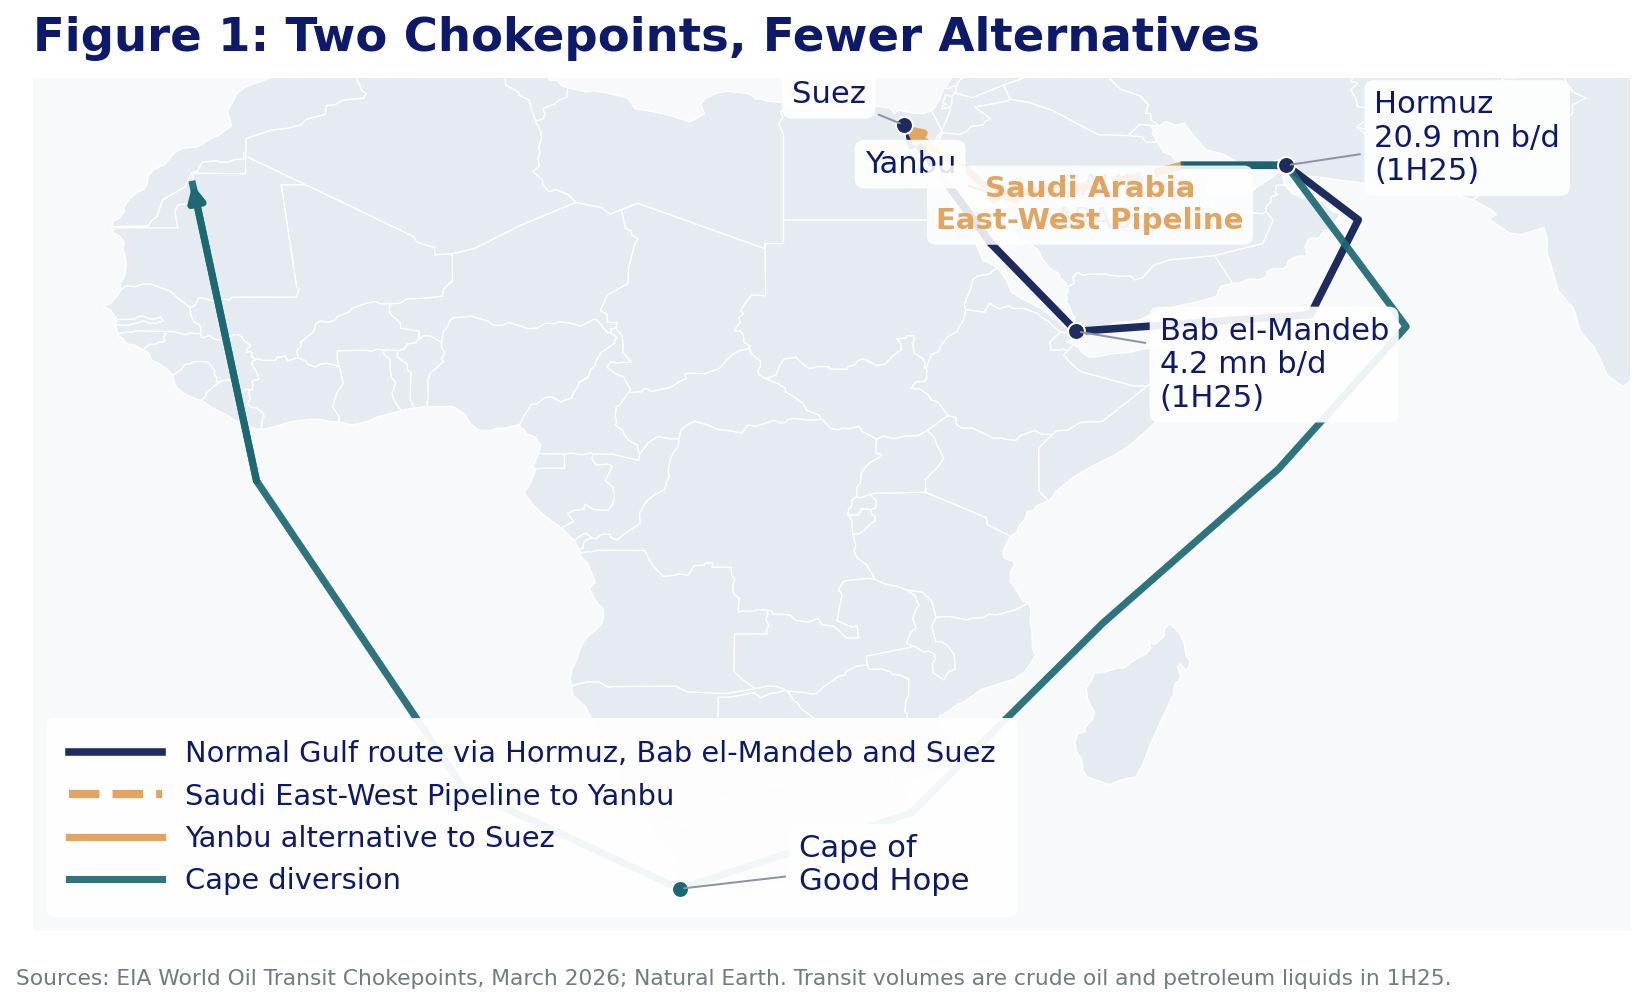
The Houthi announcement is specifically framed as a maritime embargo against Saudi shipping in the Red Sea, and a full closure of Bab el-Mandeb to all traffic has not materialised. Even so, the announcement directly weakens Saudi Arabia’s Red Sea route around Hormuz. The UAE’s Fujairah route remains available for exports to Asian markets. From here the risk splits into three scenarios. In the current situation, Saudi shipping is targeted but wider transit continues. An escalation scenario would involve attacks or insurance withdrawal disrupting broader Bab el-Mandeb traffic. An extreme scenario would see the strait become effectively inaccessible for most cargoes.
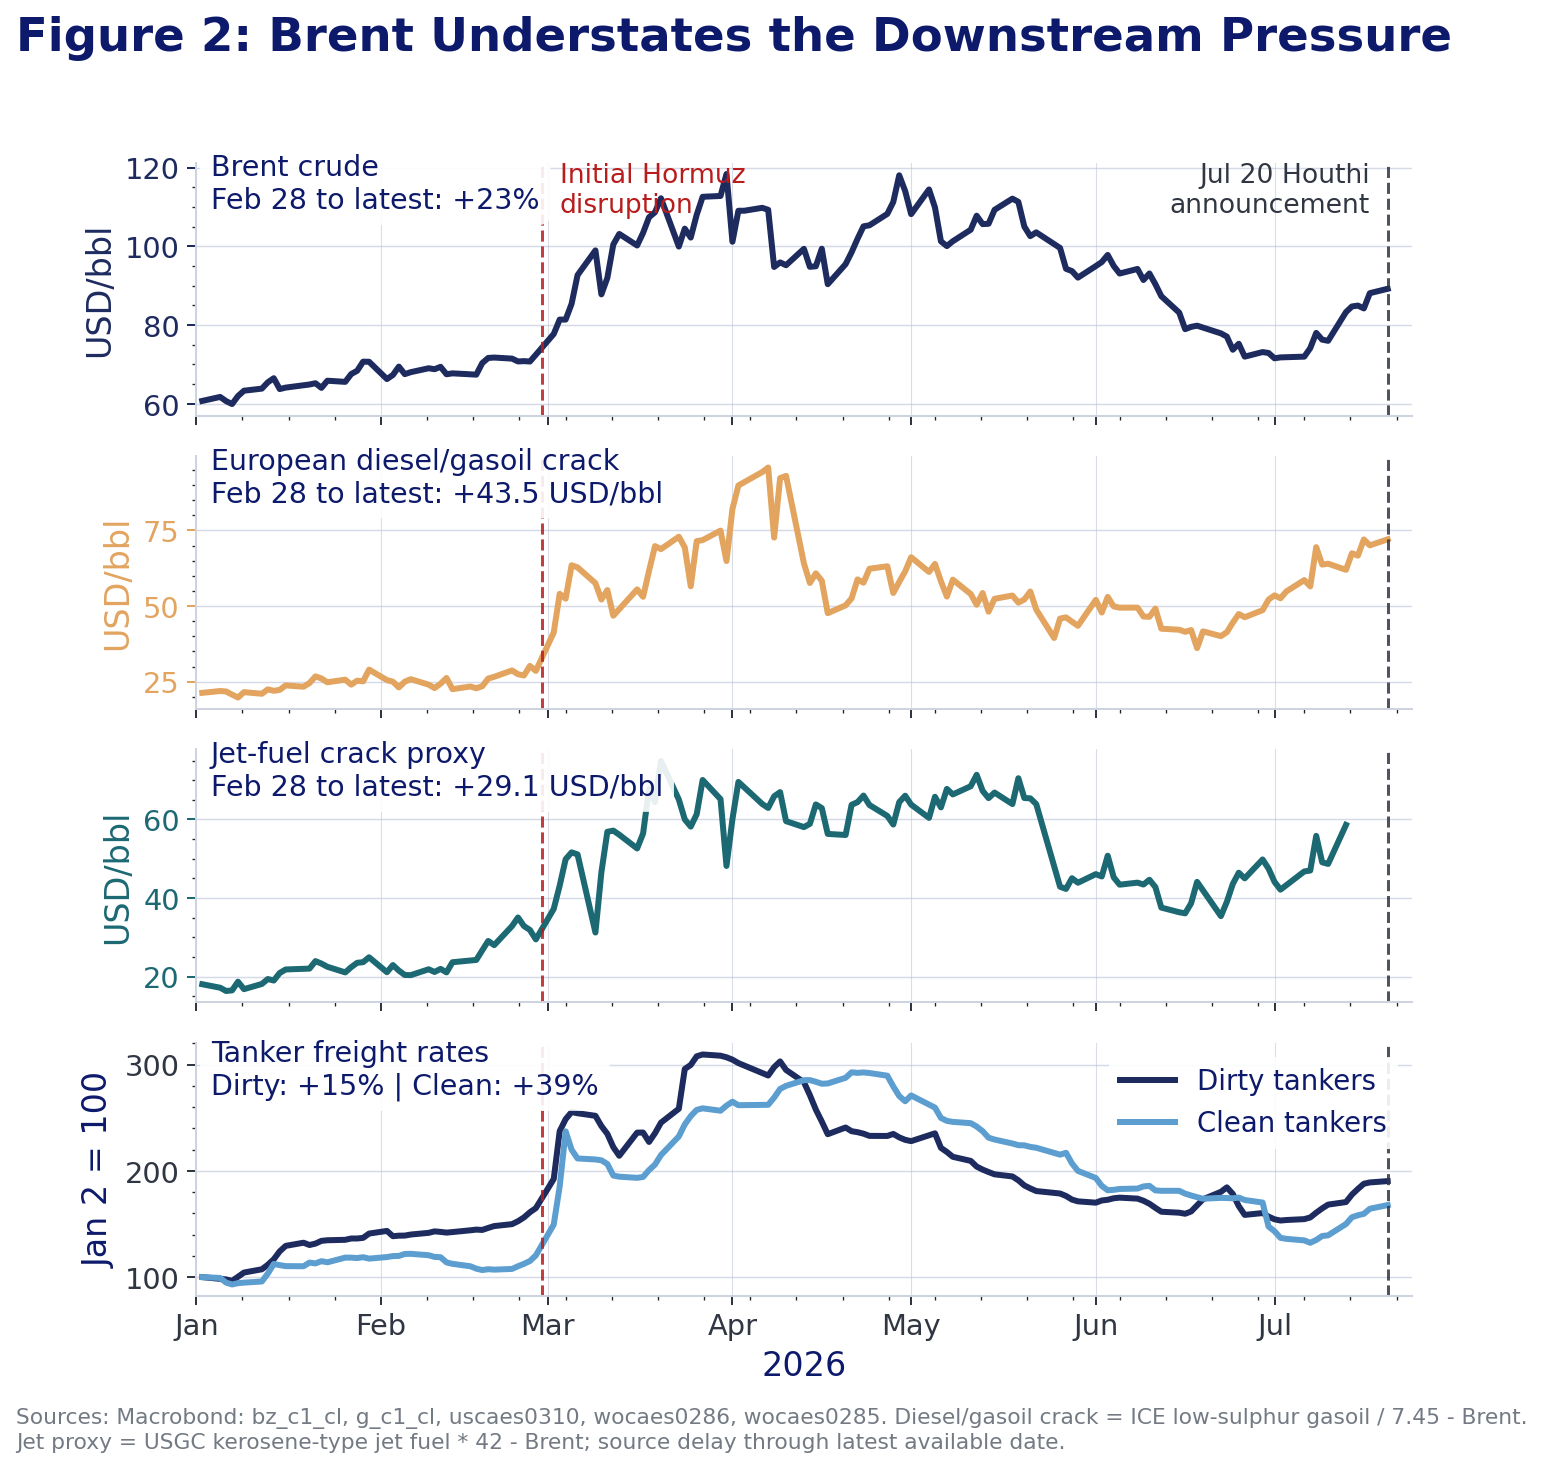
Brent closed at $89.22 per barrel on July 20 after the announcement (Figure 2), but the larger inflation risk lies in delivery constraints. If the disruption delays crude and refined products, the effective cost of energy can rise even without a comparable increase in the benchmark oil price.
More than 3 million barrels per day of Saudi crude is currently being loaded at Yanbu, much of it destined for Asian markets. These volumes remain dependent on passage through Bab el-Mandeb. Where Cape rerouting remains operationally possible for cargoes that continue to transit the strait but avoid the Suez route, one-way voyages may lengthen by roughly one to two weeks depending on origin, destination and vessel speed, absorbing effective tanker capacity and leaving refiners more dependent on inventories or replacement cargoes. If Bab el-Mandeb itself becomes inaccessible, however, Yanbu exports to Asia would be directly constrained rather than merely delayed.
The downstream pressure may be more visible in refined-product margins and tanker freight rates than in Brent alone. European diesel refining margins were already close to $65 per barrel following the Houthi announcement, and the jet-fuel crack proxy has risen by around $29 per barrel since late February (Figure 2). Clean-tanker freight rates, which price the movement of refined products, are up 39 percent over the same window against a 15 percent rise for dirty tankers, consistent with tighter product markets than crude and pointing to stronger pressure in the fuels that feed most directly into transport costs and consumer prices.
Asia is the most directly exposed region. Around 80 percent of all oil volumes transiting Hormuz are destined for Asia. Within the crude component, China and India together received 44 percent of Hormuz crude exports in 2025. Japan and South Korea also remain heavily dependent on Gulf supply. Only around 4 percent of Hormuz crude flows directly to Europe, although Europe remains indirectly exposed through globally traded refined products, freight and the reallocation of cargoes. In an escalation scenario that extends disruption from Hormuz into Bab el-Mandeb, Asian refinery supply, shipping schedules and energy-import bills would be hit first.
Higher import costs could also weaken regional currencies, amplifying the local-currency price of dollar-denominated oil. The shock would then spread through electricity, transport, chemicals, plastics and industrial production. Subsidies, tax cuts and administered fuel prices can delay the CPI impact, but they shift the cost to public finances or state-owned energy companies rather than remove it.
Europe is less exposed to Gulf crude directly, but more vulnerable to refined fuels and disruption along the Asia-Suez trade route. Diversions around the Cape of Good Hope would extend delivery times, absorb shipping capacity and raise the landed cost of manufactured goods and intermediate inputs. The initial impact is likely to appear in diesel, freight and import prices, followed later by consumer goods as inventories are replenished.
Latin America faces a particularly difficult policy trade-off
To read the rest, visit out latest Substack post here.
Research Archive
Macroeconomic Insights: Eurozone CPI — “Sweater Weather” Is Repricing Energy Risk
Energy markets have moved back to the foreground as a near-term driver of Eurozone headline inflation. Colder January temperatures lifted heating and power demand into a winter...
AI coding is like making a burger with sugar
Have you ever had a burger, and then noticed something is kind of off. You’re hunting for the reason. Then it’s immediately obvious: they put sugar instead of salt. Ok, this has...
Macroeconomic Insights: Turkey CPI – Inflation Pinned in Gold
Gold jewelry remains a common wedding gift in Turkey, reflecting a cultural practice where households preserve wealth through physical gold rather than financial assets. This...
Macroeconomic Insights: US CPI – November’s Weakness is Not All December’s Gain
The October–November 2025 CPI sequence contained meaningful measurement distortions linked to the federal government shutdown. BLS has since confirmed that most CPI operations...
Macroeconomic Insights: Colombia CPI – Minimum Wage Shock Meets Fiscal Emergency
Turnleaf expects Colombia CPI to accelerate towards 6% YoY starting January 2026 following a 23.7% minimum wage increase that took effect on January 1—a significant upward...
Inflation Outlook 2026: New Year, New Inflation Regime?
Over the past year, global disinflation efforts have been complicated by escalating trade tensions that slowed global growth, geopolitical conflicts in the Middle East and...
Hundreds of quant papers from #QuantLinkADay in 2025
I tweet a lot (from @saeedamenfx and at BlueSky at @saeedamenfx.bsky.social)! In amongst the tweets about burgers, I tweet out a quant paper or link every day under the hashtag...
Macroeconomic Insights: U.S. CPI – Now What?
The October and November 2025 CPI prints were materially affected by technical distortions related to the federal government shutdown. These distortions are likely to produce a...
Macroeconomic Insights: What Drove US CPI Lower?
US CPI YoY NSA came in at 2.7%, significantly below consensus expectations (3.1%) and our own model forecast (3.0%). Core CPI YoY NSA also printed weaker at 2.6% versus market...
Macroeconomic Insights: Chile CPI – It’s Not All That Bad
Turnleaf expects Chilean inflation to ease below the central bank's 3% target in early 2025, driven by peso appreciation compressing import prices and subdued energy costs...
Macroeconomic Insights: US CPI – Natural Gas Price Dynamics and Inflation Pass-Through
The recent spike in natural gas futures reflects market expectations of future supply constraints. Unlike past volatility driven by weather alone, this increase stems from...
Macroeconomic Insights: Switzerland CPI – Inflation Not Hot Not Cold
Last month Turnleaf argued that Switzerland was escaping deflation but still stuck near 0% inflation over the next year, with any firming coming mainly from tax changes and...
Macroeconomic Insights: Australia Inflation Sparks Concern
Reaching 3.8% YoY in October 2025, headline CPI is currently above both the RBA's 2–3% target band and the market consensus forecast of 3.6% (ABS CPI October 2025). Turnleaf's...
Macroeconomic Insights: India CPI – Structural Pressures Emerge
In the past month Turnleaf's 12-month inflation forecast for India has edged lower as the pace of food and energy price increases slowed. This moderation reflects seasonal...
QuantMinds London 2025
"Are you on mute?" is perhaps the most succinct catchphrase which most comprehensively describes the post-covid landscape of work. Yet, despite the plethora of video conferencing...