
Featured Research
Macroeconomic Insights: Nowcasting APAC Through the Hormuz Shock
No region sits closer to the February 2026 closure of the Strait of Hormuz than Asia. On Energy Information Administration (EIA) estimates, roughly four fifths of the crude that transited the strait before the closure was delivered to Asian markets, with China, India,...
Macroeconomic Insights: Nowcasting APAC Through the Hormuz Shock
No region sits closer to the February 2026 closure of the Strait of Hormuz than Asia. On Energy Information Administration (EIA) estimates, roughly four fifths of the crude that transited the strait before the closure was delivered to Asian markets, with China, India, Japan and South Korea the four largest destinations, and a comparable share of Qatari liquefied natural gas (LNG) moved through the same chokepoint to buyers concentrated in the same four economies. Latin America experienced this shock as a benchmark price. Asia experienced it as a physical supply disruption, layered with freight rerouting, war-risk insurance premia and competition for non-Gulf barrels that raised landed costs by more than the move in Brent alone. Yet nearly six months on, eight countries within the region most dependent on Gulf crude have experienced very different inflation shocks.
The dispersion starts behind the chokepoint, in how each economy converts the same landed-cost shock into consumer prices. Japan and South Korea source the overwhelming majority of their crude from the Middle East, near 95% in Japan’s case on Ministry of Economy, Trade and Industry (METI) figures, but both economies meet the consumer through deregulated fuel markets, hedged utilities and, in Japan’s case, a pre-existing disinflation from unwinding food base effects. In both economies the retail fuel price is set by the market, and the buffering comes from government subsidy and tax decisions layered on top of it, which are renewed or allowed to lapse on their own timetable.
The Philippines imports essentially all of its crude and refined products and passes world prices to the pump with little intermediation, giving it the fullest first-round exposure in the region. Thailand is as import-dependent but less exposed, because the Oil Fuel Fund and the regulated electricity tariff sit between world prices and the consumer, making it a policy-buffered pass-through case. India and Indonesia stand between these poles, heavy importers whose excise and administered-price instruments meter the pass-through.
Malaysia is the structural exception, the only net energy exporter in our Asian panel, whose petroleum revenues rise with the same shock its RON95 retail ceiling suppresses, so the fiscal position that funds the buffer strengthens as the buffer becomes more expensive. And China, the single largest buyer of Gulf crude, is the one economy where the domestic demand cycle is weak enough to block transmission almost entirely. The latest realised readings reflect that spread, spanning 0.5% YoY in China and 2.0% in Thailand to 6.2% in the Philippines, with South Korea at 2.8%, Indonesia at 2.9%, Malaysia at 2.0%, Japan at 1.7% and India at 4.5% on the most recent available prints.
Reading the Vintages
More telling than the levels is the direction of our own revisions. Since June our forecast curves have been walked steadily lower for Thailand, South Korea, the Philippines and China, while Malaysia, Indonesia and Japan have been revised up, and India has barely moved. The peak pass-through scenario our models priced at the height of the shock is being unwound in the economies where it was largest, at the same time as delayed and policy-mediated effects surface in the economies where the first round was suppressed.
The First Round Runs Its Course
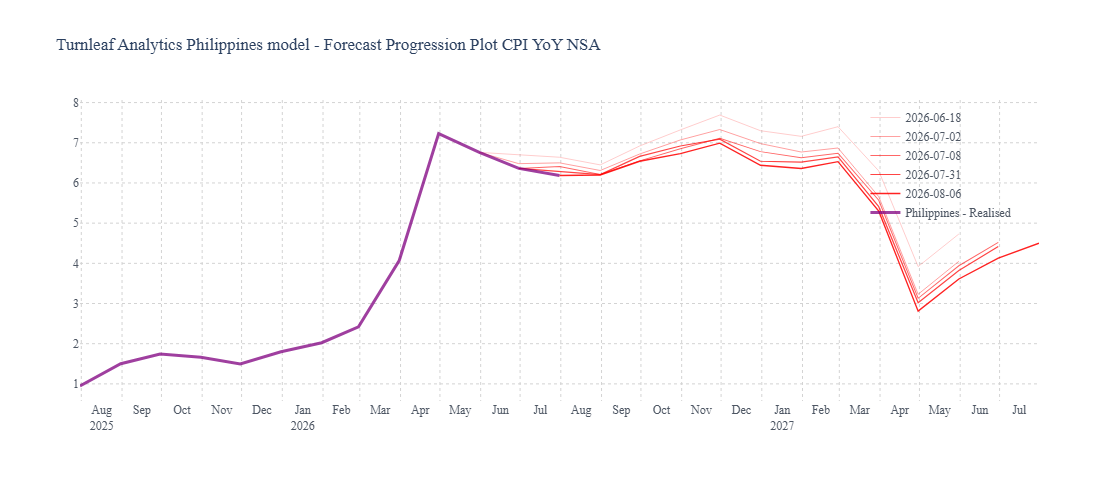
The Philippines remains the cleanest pass-through case in our Asian coverage, and the one where the revisions are almost entirely a cost-environment update. With little administered-price apparatus standing between world prices and the pump, the realised prints have tracked our curves closely, 7.2% YoY at the April peak and 6.2% in July, confirming that the first round went through in full. Our June vintages were generated at the height of the disruption, with the landed-cost impulse from crude, freight rerouting and war-risk premia at its widest, and each subsequent vintage has incorporated the normalisation of those conditions as it has entered the data. The curve has accordingly come down in parallel across the whole horizon, the pattern produced by an easing cost environment. Our 6 August curve holds inflation near 7% into November before base effects cut it to roughly 3% by April 2027, with the remaining forward risk in transport fares and food logistics, the components that reprice with a lag (Figure 1).
Figure 1
Thailand shows the largest downward revision in the region, and the sequence of vintages reflects both the incoming prints and the policy decisions behind them. The May, June and July prints, ending at 2.0% YoY in July, arrived as Thai policy was actively responding to the shock, with the Oil Fuel Fund’s retail caps and the regulated electricity tariff set period by period. Each successive vintage has incorporated those decisions as they were taken, so the progression from the 8 June curve, which peaked near 5.6% in early 2027, to the 6 August curve, which peaks at roughly 3.2% and falls towards 0.3% by April 2027 as the April 2026 jump drops out of the base, tracks the accumulation of policy interventions alongside the softer prints they produced (Figure 2). On the current curve the Thai shock resolves as a level shift contained by price administration, and the low post-base-effect trough reflects that Thailand entered this episode from outright deflation.
To read the rest, visit our latest Substack post, here.
Research Archive
Macroeconomic Insights: How U.S. Tariffs and Eurozone Weakness Are Shaping Chinese Inflation
The trajectory of Chinese inflation will largely depend on its sensitivity to U.S. tariffs and its ability to sustain domestic GDP growth through external demand, particularly...
Macroeconomic Insights: Prices to Increase in February 2025 as Canada’s Tax Holiday Takes a Holiday
Between mid-December 2024 and mid-February 2025, the Canadian government implemented a GST/HST tax holiday, exempting beverages, restaurants, children’s clothing and footwear,...
Macroeconomic Insights: Fueling the Inflation Fire – Turnleaf’s Turkish Inflation Curve Shifts Upwards
Turnleaf’s latest data has pushed Turkey’s inflation outlook higher than consensus forecasts. There are multiple reasons for this which we will explain in this note. One of the...
Macroeconomic Insights: Assessing the Inflationary Impact of U.S. Steel & Aluminum Tariffs
The newly announced 25% tariff on U.S. steel and aluminum imports introduces cost pressures across global supply chains. However, the key question is not just how markets react,...
Emerging Markets: January 2025 Colombia and Hungary CPI YoY Forecast Review
2025 Colombia CPI YoY Above Consensus Due to Global Inflation Pressures Turnleaf’s CPI YoY model projects Colombia inflation well above consensus 12 months out, as it more...
Emerging Markets: January 2025 India CPI YoY Forecast Review
In our January 2025 YoY CPI forecast, we projected inflation at 4.57%, slightly above the realized 4.3%, yet outperforming consensus (4.71%)—even with our estimate released a...
Macroeconomic Insights: 2025 Eurozone Inflation Outlook – 4 Key Charts to Watch
Turnleaf is forecasting 2–2.5% headline inflation for the Eurozone in 2025, while core inflation is expected to decline through the end of the year towards 2% as momentum in wage...
DeepSeek, objectives and constraints
When a new burger joint opens up, there's often a buzz. Everyone (well, at least me) wants to try the new burger. Is it as good as it looks on Instagram? Or is it just style over...
Hundreds of quant papers from #QuantLinkADay in 2024
I tweet a lot (from @saeedamenfx and at BlueSky at @saeedamenfx.bsky.social)! In amongst, the tweets about burgers, I tweet out a quant paper or link every day under the hashtag...
What we’ve learnt from reading thousands of Fed communications
We recently had the last FOMC decision of 2024. Market l participants reacted to the hawkish tone including Powell’s comments that the Fed’s year-end inflation projection has...
Flash Inflation Outlook: The Cost of Stability, Poland’s Extended Energy Caps
The Polish government’s decision to extend the cap on electricity prices at 500 PLN/MWh is a critical measure to limit inflationary pressures on households. To understand its...
Macroeconomic Insights: A Pinch of Real Rates, a Dash of Slack: Turnleaf’s 2025 U.S. Inflation Recipe
At Turnleaf Analytics, leveraging our machine learning models, we project U.S. inflation to stabilize between 2–3% through 2025, shaped by the interplay of import inflation,...
Macroeconomic Insights: Rising Costs Hit Germany Where It Can’t Afford It—Manufacturing
Germany, long regarded as Europe’s economic powerhouse, owes much of its success to its export-driven industrial base. However, recent years have seen this foundation weaken...
Macroeconomic Insights: France’s Inflation Outlook Amid Fiscal and Economic Pressures
France’s inflation remains near the European Central Bank’s (ECB) 2% target despite significant fiscal spending during the pandemic and in response to the war in Ukraine....
Flash Inflation Outlook: South Korea Inflation Amid Political Instability
South Korea’s brief declaration and subsequent revocation of martial law by President Yoon has damaged investor confidence, further weakening the won and placing pressure on the...