Featured Research
Macroeconomic Insights: What Comes Up, Must Come Down?
Today, the United States and Iran have signed a deal ending the war. Among the many points outlined in the agreement, the normalization of trade through the Strait of Hormuz, scheduled for tomorrow, is the most consequential for oil markets. Front-month futures fell...
Macroeconomic Insights: What Comes Up, Must Come Down?
Today, the United States and Iran have signed a deal ending the war. Among the many points outlined in the agreement, the normalization of trade through the Strait of Hormuz, scheduled for tomorrow, is the most consequential for oil markets. Front-month futures fell sharply after the announcement with the International Energy Agency warning that the market could swing back into surplus once supply through the strait resumes and the more than one hundred oil-laden tankers currently stranded in the Gulf are released (Figure 1).
Figure 1
WTI futures term structure before and after the Trump-Iran memorandum of understanding (NYMEX WTI via Oilprice.com, Barchart and Investing.com).
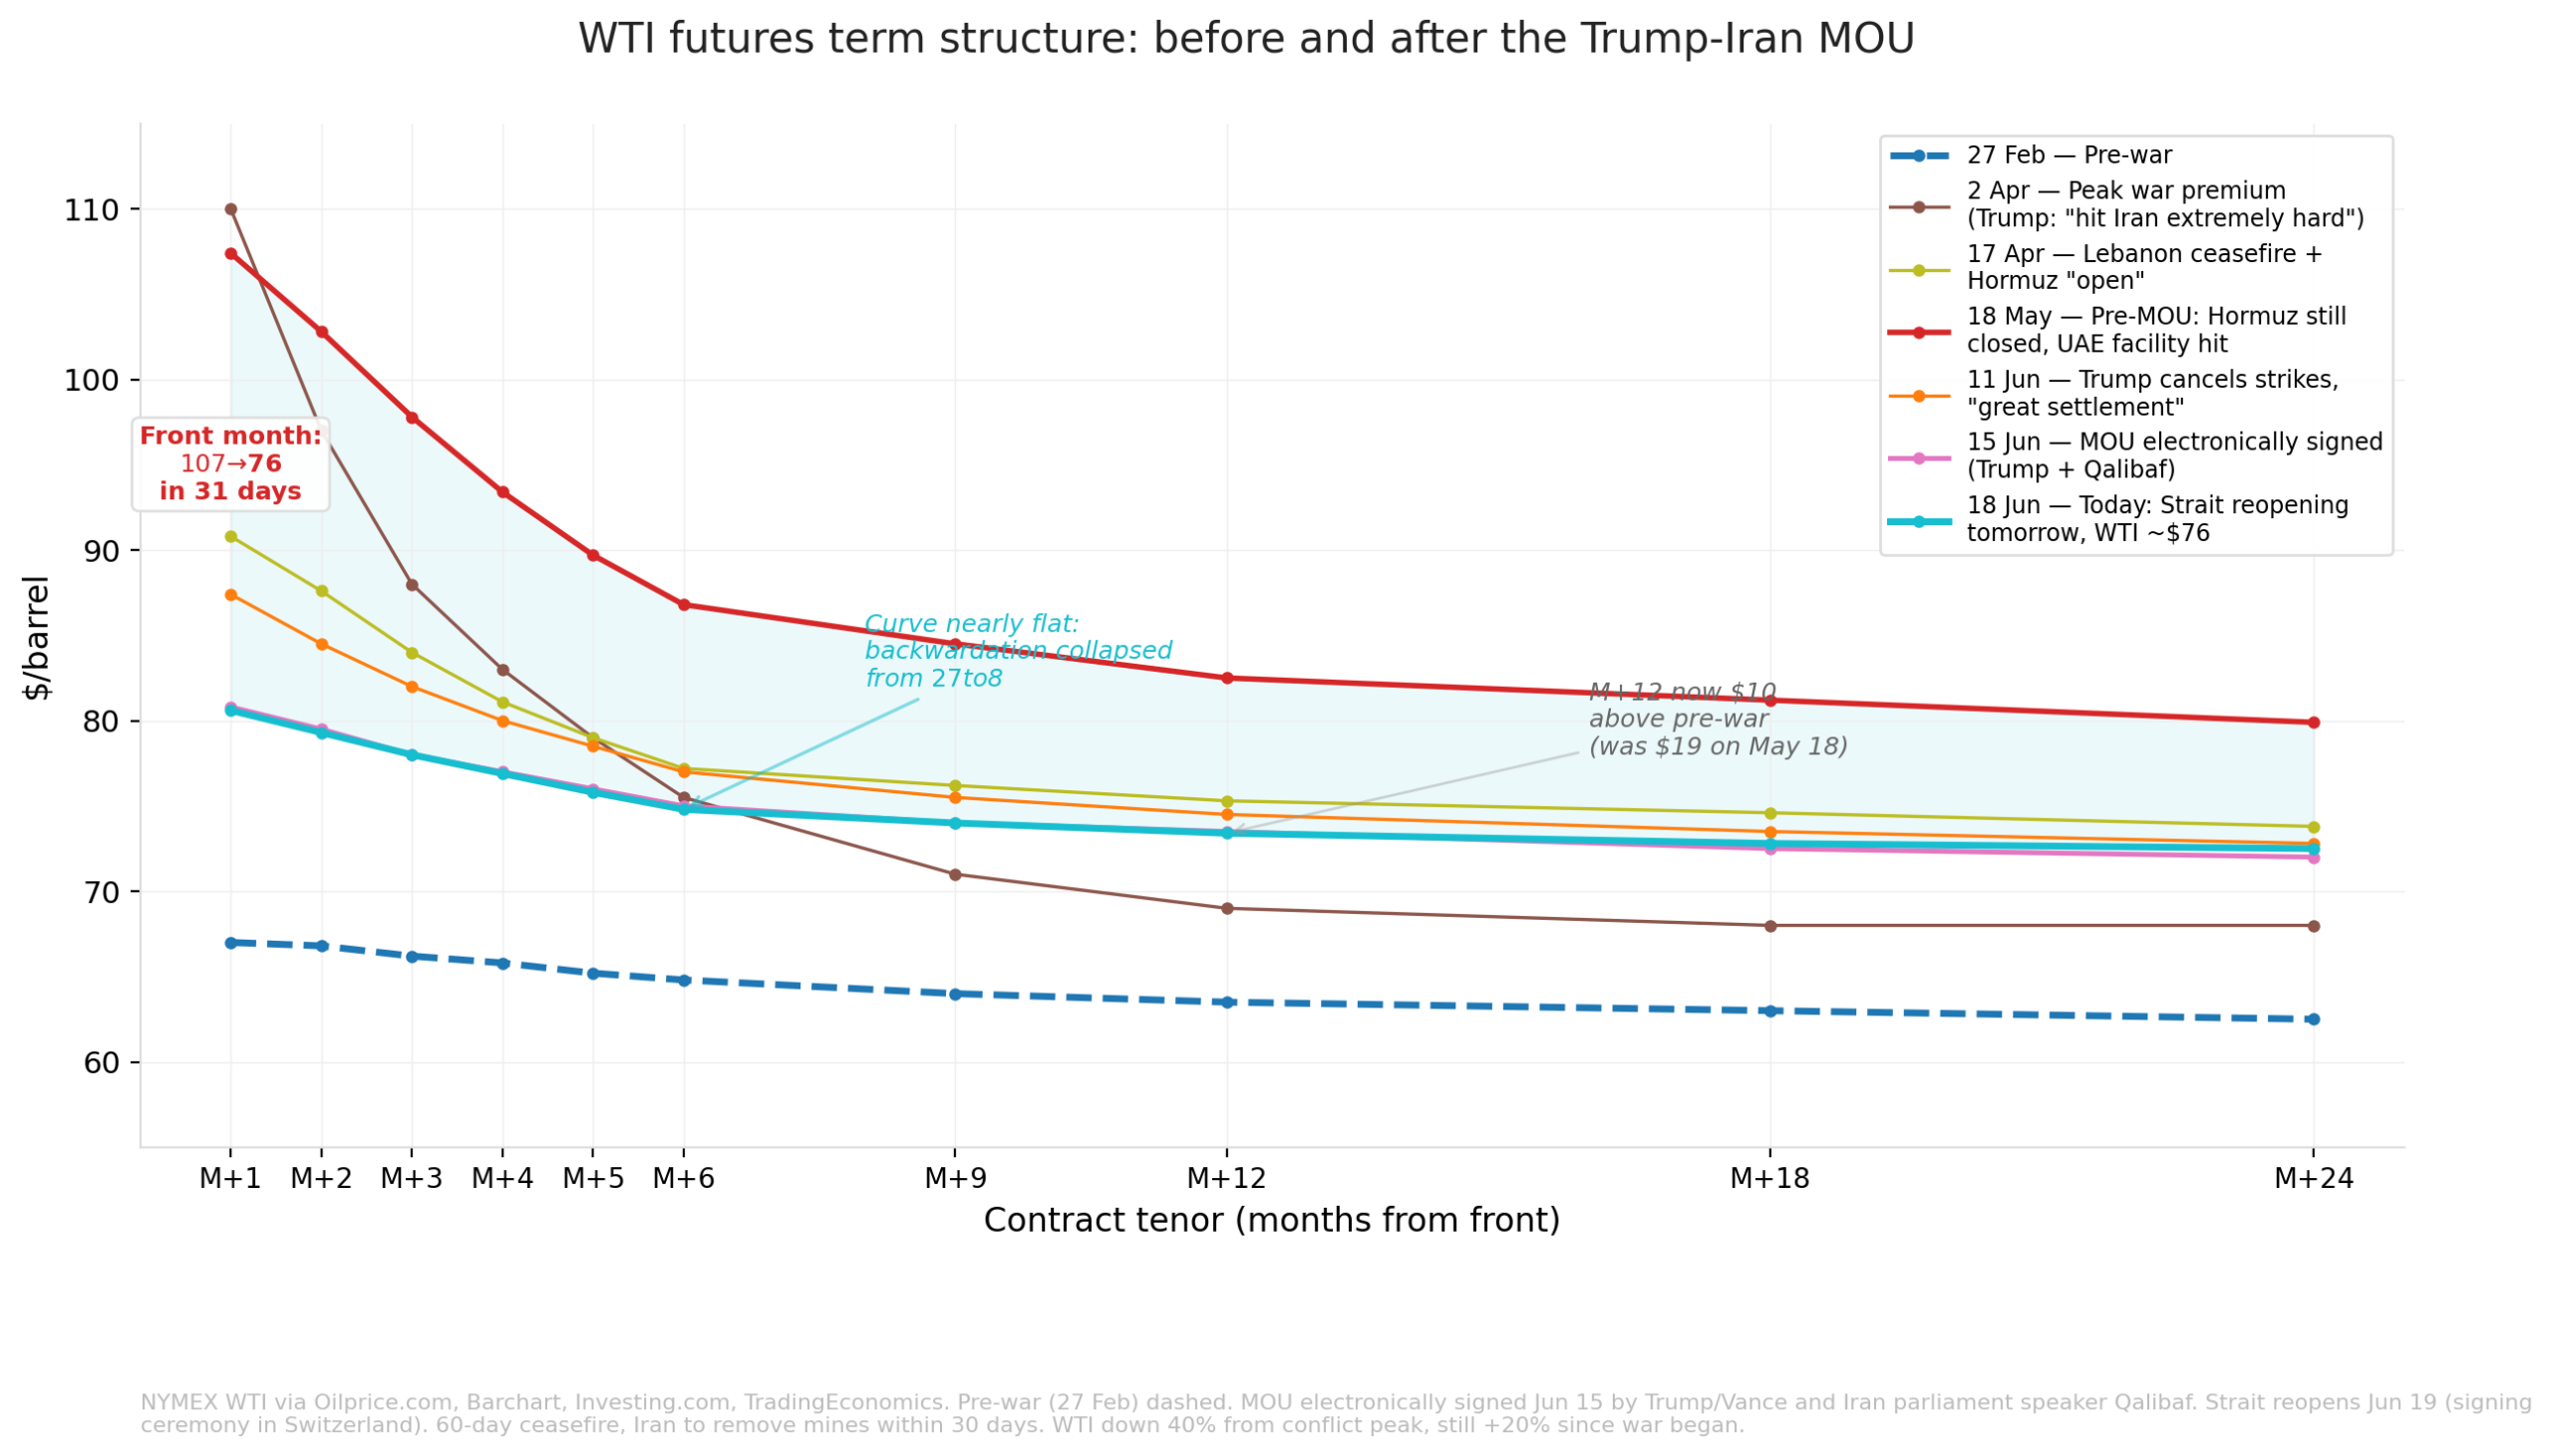
The repricing has been concentrated almost entirely at the front of the curve. The front-month contract has fallen from around 107 dollars ahead of the deal to 76 dollars, a decline of 29 per cent, and now trades roughly 40 per cent below the conflict peak reached in early April. The back end has barely moved and is converging towards the pre-war strip, leaving the curve far flatter than at any point since the strait was closed. The shape tells us the market reads the shock as an acute supply interruption that is now unwinding. With the long end anchored close to where it traded in February, investors are pricing the normalisation of flows without a return to the scarcity premium that defined the spring.
Though global crude benchmarks heavily influence local retail fuel prices, the path back down tends to be far less responsive than the climb upwards, a pattern long documented in pump pricing and often described as rockets and feathers. As we noted in the previous blog, oil inventories and tax cushions have helped to mitigate the supply shock for many countries, and the same buffers now slow the pass-through of cheaper crude to consumers. A closer look at Turnleaf’s high frequency fuel indices shows a mixed response when plotted against available reserves that continue to be drawn down (Figures 2 and 3).
Figure 2
United States retail diesel and gasoline prices against crude oil inventories, last five years (Macrobond and Turnleaf Analytics).
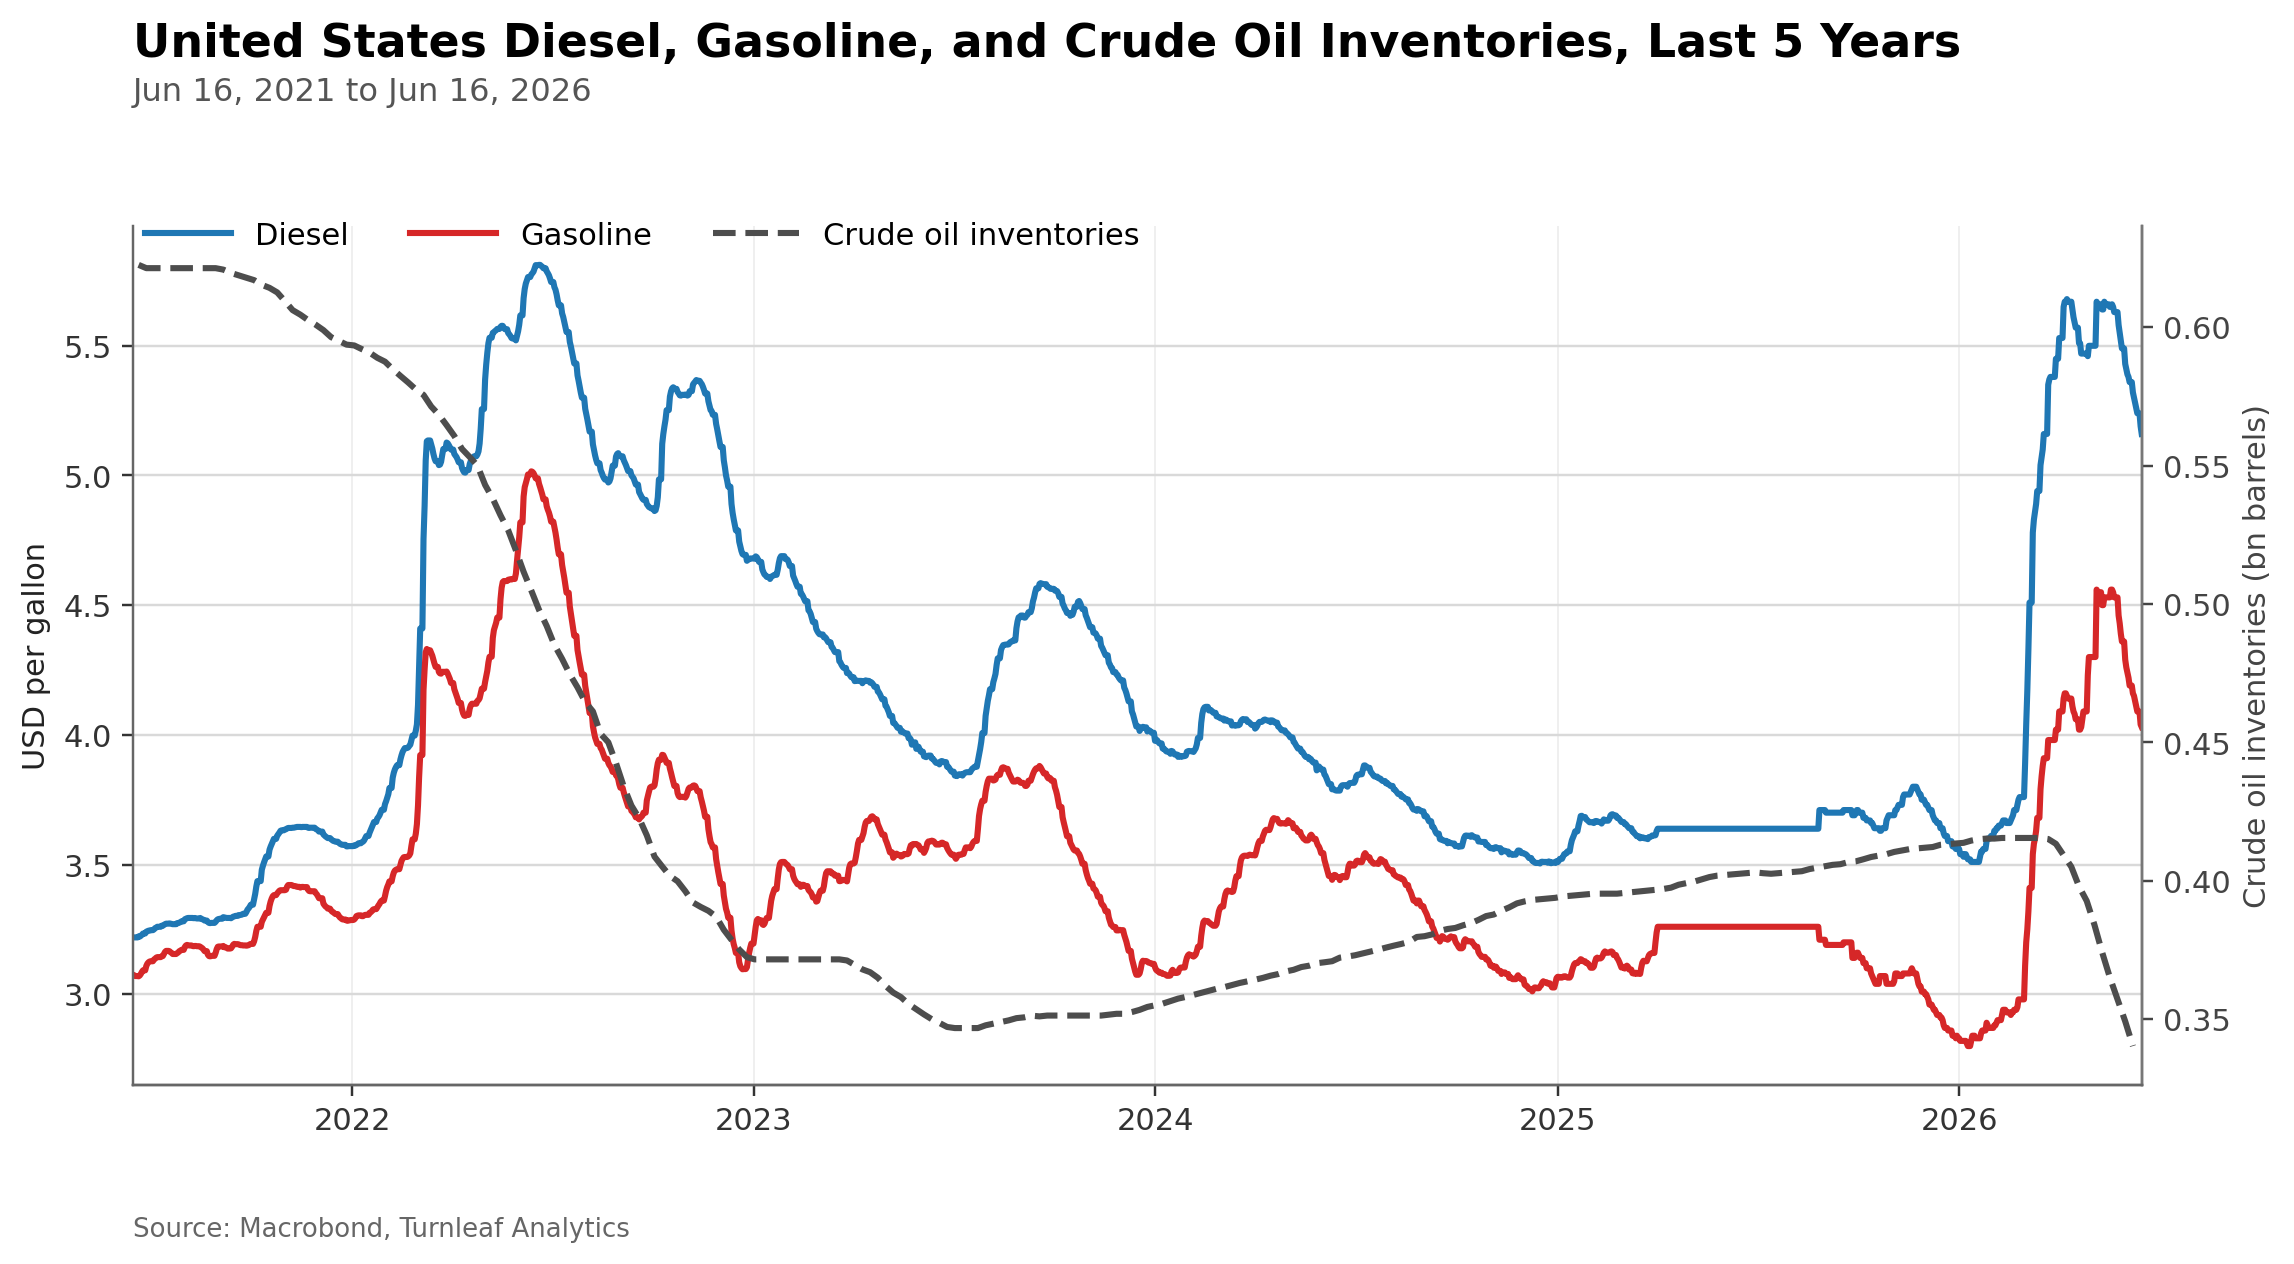
Figure 3
United Kingdom retail diesel and gasoline prices against crude oil inventories, last five years (Macrobond and Turnleaf Analytics).
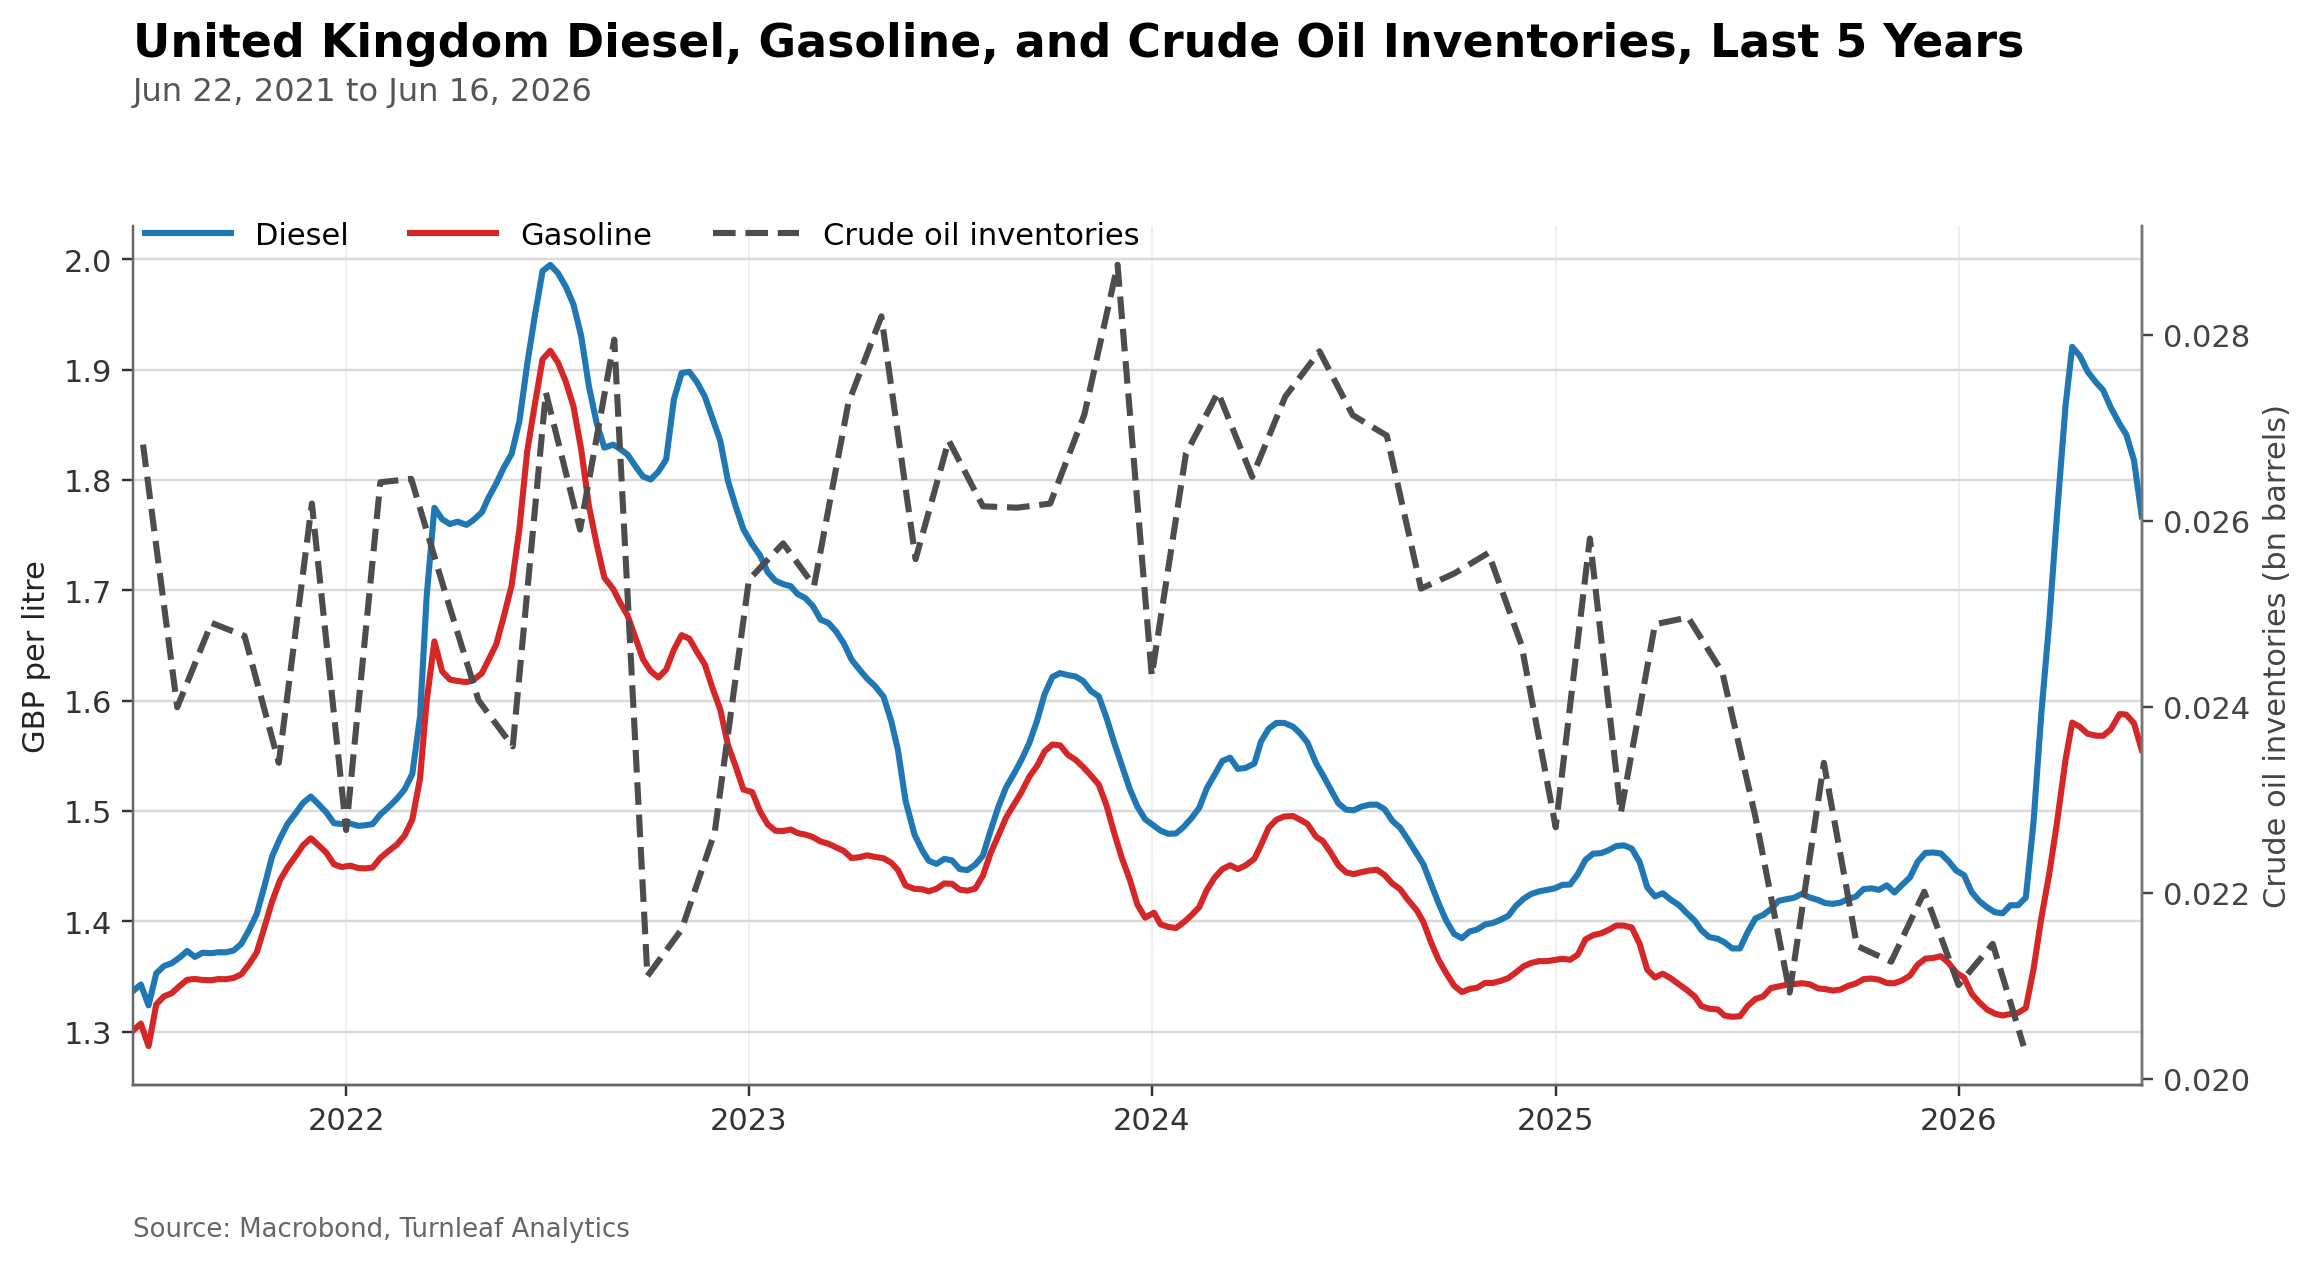
Both panels show the same dynamic. Retail diesel and gasoline spiked through the spring as the conflict escalated, while crude inventories, the dashed line, were drawn down hard to meet demand and now sit near the bottom of their five-year range, with the recent US draw among the steepest in the series. Retail prices have since eased only modestly and remain well above pre-shock levels, and in the United States the national average gasoline price has only just slipped back below four dollars. The inventory position is what the futures curve does not capture. Stocks this depleted have to be rebuilt, and restocking is itself a fresh call on crude that supports prices and slows the fall at the pump. The buffer that cushioned the shock on the way up becomes a source of demand on the way down. Set against sticky retail margins and the policy support layered on during the worst of the shock, this points to a slow and incomplete disinflation in retail fuel even as wholesale crude falls.
How Will This Affect Turnleaf’s Forecasts?
We will refresh all affected models over the coming days. Our U.S. 12-month inflation curve has fallen since last week, but recent news and futures pricing suggest little change at the long end (Figure 4 – see our latest Substack, here). As a result, medium-term energy assumptions are moving only modestly despite lower near-term prints. We therefore do not expect the shock to unwind in the short term. The disinflationary impulse from cheaper crude will feed through to headline inflation across the coverage universe, but the lagged and incomplete pass-through to retail fuel, together with the buffers described above, means the effect on core measures will be more muted and slower to arrive than the headline move in oil might suggest.
Risks to the Inflation Path
The risks around this path run in both directions. To the downside for inflation, the reopening of the strait could add supply faster than the market expects. The immediate resumption of previously sanctioned Iranian exports, the release of the tanker fleet stranded in the Gulf, a more aggressive OPEC production policy and continued non-OPEC supply growth could together tip the market back into the surplus the Agency has flagged for the fourth quarter, pushing crude and eventually retail fuel lower still. Softer Chinese demand and the persistence of tax holidays in several countries would reinforce that disinflationary pull.
To the upside, the agreement remains fragile and contested. Shipping firms are cautious about returning to the strait while the threat from mines, drones and missiles persists, and any delay in clearing the waterway would keep a risk premium in prices. The durability of the agreement is far from assured given continued fighting between Israel and Hezbollah in southern Lebanon and the unresolved status of Iran’s nuclear programme. Beyond the strait, how long Russian natural gas sanctions endure, and how much of the gas infrastructure damaged during the conflict in Qatar and other regional hubs returns to service, could add fresh pressure to energy inputs even as crude falls. The eventual unwinding of the tax holidays and subsidies that cushioned the shock would also push retail prices back up independently of the oil price.
As usual, we will continue monitoring the underlying data that so often reveals the true price story.
Research Archive
The dollar, yields and inflation
Harold Wilson once said a week is a long time in politics. He might have had the foresight to be referring to Liberation Day and the subsequent fallout into markets. One...
Macroeconomic Insights: 90 More Days of Letting the Data Speak
Within hours of the large-scale tariffs taking effect, the Trump administration announced a 90-day pause, replacing the full tariff package with a baseline 10% rate. China—among...
Macroeconomic Insights: Tariffs Shock U.S. Inflation Expectations
The recent imposition of sweeping U.S. tariffs has triggered a sharp stock market selloff, erasing up to $2.5 trillion in market value. More importantly, this sell-off reflects...
Neudata 2025 London conference
I recently attended the Neudata conference on alternative data in London. I had last gone quite a few years ago, and I was pleasantly surprised about how much bigger the event...
Liberation Day Arrives – Market Prints Fall in Line with Turnleaf Expectations
Yesterday, President Trump announced a minimum 10% tariff on all imports into the United States, with higher rates targeted at countries running large trade surpluses with the...
Turnleaf Forecast Review: Recent Misses and Outcomes
This issue aims to clarify several of Turnleaf’s and the market’s forecast deviations over the past few months. Below, we outline key insights and performance drivers across a...
Macroeconomic Insights: India’s Inflation Paradox – Headline Drops, Core Rises
In recent forecasts, Turnleaf has observed an interesting trend in India’s inflation dynamics. While headline inflation has been trending downward, largely driven by a decrease...
Macroeconomic Insights: Polish Inflation – What Could Be, What Won’t Be in 2025
Recent retail sales in Poland have come in below expectations (-0.5%YoY in February 2025), with a significant decline driven by vehicle sales, followed by reduced consumption in...
Macroeconomic Insights: Mexico’s Inflation Path In Tariff Uncertainty Limbo
The tail of our inflation curve is currently driven by two key factors: U.S. tariffs set for April 2, 2025, and Plan Mexico, which aims to revitalize domestic manufacturing and...
Macroeconomic Insights: How Germany’s Fiscal Stimulus Could Reshape Its Inflation Outlook
Amid shifting geopolitical tensions and the need to revitalise its economy, Germany is preparing for a massive fiscal stimulus that will allocate up to $1 trillion in defence and...
Emerging Markets: Turnleaf Discusses Impact on Hungary’s 10% Profit Margin Cap Restriction on Inflation
Policy: In Hungary, from March 17 to May 31, 2025, a 10% profit margin cap will be imposed on 30 essential products, limiting companies' profits on these items. Small independent...
Macroeconomic Insights: U.S. Inflation is Coming, But Not Where You Expect
Since taking office, President Trump has aggressively worked to revitalize domestic manufacturing by focusing on the U.S. trade balance. A key part of this strategy has been...
Learning from running financial models live
Let's say you are the world's best burger chef (we all have ambitions, right). You'd be serving up all manner of burgers for your customers. It would be odd though, wouldn't it,...
Macroeconomics Insights – Beyond Tariffs: How Uncertainty is Steering U.S. Inflation Expectations
When we forecast inflation, our goal is to account for as much explainable variation as possible, using available data and reasonable assumptions about how prices evolve....
Macroeconomic Insights: Tariffs, Manufacturing, and Mexico Inflation
This article marks the start of Turnleaf’s series on how U.S. tariffs shape inflation dynamics across Latin America (LATAM). Among the economies we monitor—Colombia, Brazil,...