Featured Research
Macroeconomic Insights: US CPI – The Strange Swing in U.S. Cell Service Prices
The wireless telephone services component of US CPI has been behaving strangely over the past year. The recent behaviour is really two things stacked on top of a long structural trend. The first is a methodology change. From the July 2025 CPI, released in August, BLS...
Macroeconomic Insights: US CPI – The Strange Swing in U.S. Cell Service Prices
The wireless telephone services component of US CPI has been behaving strangely over the past year. The recent behaviour is really two things stacked on top of a long structural trend.
The first is a methodology change. From the July 2025 CPI, released in August, BLS switched wireless telephone services to an alternative data, hedonic approach, scraping a near universe of carrier and MVNO plan prices, running them through a hedonic regression re-estimated every month, then aggregating with a Törnqvist index. That made the series move more sharply than it used to.
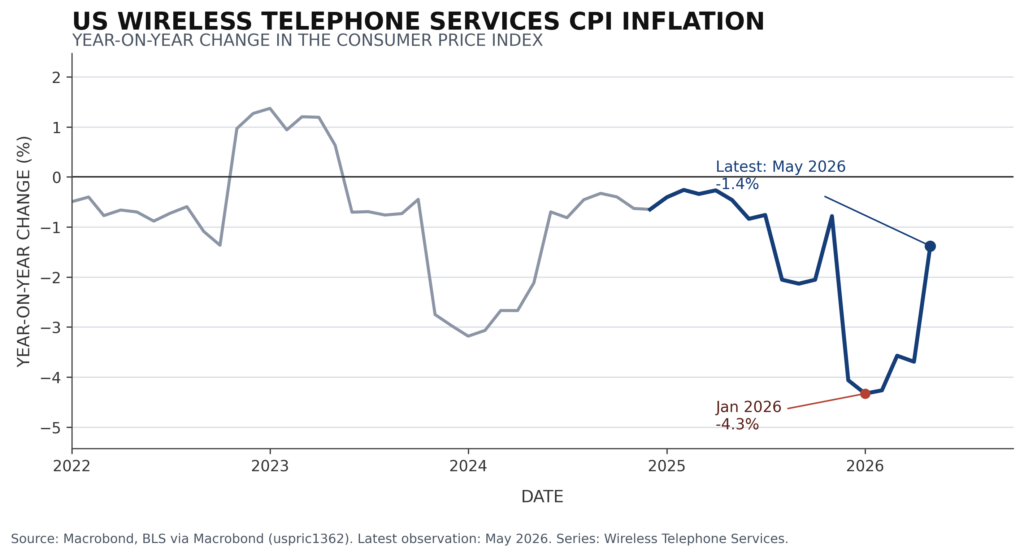
The second is a competitive plan shock followed by spring price hikes. BLS’s wireless telephone services CPI is built from plan level price and characteristics data for MNO and MVNO service plans, so broad changes in available plan pricing can flow through to the index. A late 2025 competitive push on lower priced prepaid and unlimited plans appears to have coincided with a 3.3% seasonally adjusted drop in December, the largest one month decline since March 2017, with the 12 month rate at -4.1%. The 12 month rate then bottomed at about -4.3% in January (Figure 1). In spring 2026, AT&T raised prices on select retired unlimited wireless plans beginning in April, while Verizon’s Unlimited Ultimate 1.0 became unavailable to add after May 7, and industry reporting put the new Unlimited Ultimate price at $5 a month higher. The wireless index then rebounded 2.2% in May, moving the 12 month rate back to -1.4%.
At Turnleaf, we make sure to track carrier announcements for these moves as they happen and apply a forward looking adjustment to our inflation nowcasts when material changes appear.
Figure 1
Underneath both of these developments is a much longer structural story. The index is down around 54% since 1997, and that decline has little to do with what any individual household actually pays each month. The index is quality adjusted, and carriers have spent the past quarter century bundling ever larger amounts of high speed data into plans that cost roughly the same as before. BLS treats that additional data as equivalent to a price cut, so the measured price falls even when the actual bill stays flat.
A few points are worth stressing given how easily a series like this gets misread.
To read the rest of this article, please visit our latest Substack post here.
Research Archive
Macroeconomic Insights: Gilt Selloff, Autumn 2026 Budget
The Autumn 2025 Budget, scheduled for 26 November, is expected to deliver substantial fiscal tightening. Independent forecasts estimate a tax-raising package in the region of...
Macroeconomic Insights: US CPI — Shutdown Distortions Shift the Focus to November
The 43-day U.S. government shutdown has materially degraded the quality of October’s inflation data. With BLS field operations suspended for the duration of the collection...
What would you have said?
I recently went back to Imperial College. Whilst, I've been back many times since I graduated, this was the first time that I was returning to stand in front of an audience to...
Macroeconomic Insights: Norway CPI – Hey It’s Okay, Mistakes Happen
The Norway Statistical Institute recently revised the latest CPI print from 3.3% to 3.1%, correcting an error in electricity-price calculations that overstated inflation. Despite...
Macroeconomic Insights: Abu Dhabi GDP Forecast
Turnleaf expects Abu Dhabi GDP growth to slow to 2-3%YoY in the next two quarters before hitting 7%YoY in 2026Q1 and then falling back to a bit over 3%YoY by June 2026 (Figure...
Macroeconomic Insights: Switzerland CPI – Escaping Deflation
Turnleaf expects Switzerland inflation to oscillate around 0% over the next 12 months with some indication of healthy price growth towards the tail-end of our forecast (Figure 1...
Macroeconomic Insights: Japan CPI – Nigiri Sushi Inflation
As of September 2025, Japan's inflation profile remains dominated by food price dynamics. The headline 2.9% YoY reading reflects a disproportionate rice contribution—despite...
U.S. Government Shutdown and the October 2025 CPI Print
The BLS released the September 2025 CPI print on October 24, nine days after its originally scheduled October 15 release date, following a partial recall of staff during the...
Quant Strats London 2025
Quant Strats has been a feature of the quant calendar for a number of years. I went to my first event recently after a couple of years. The event has evolved somewhat over time,...
Macroeconomic Insights: Brazil CPI — Food Costs, Currency Dynamics, and the Path to 4%
Brazilian inflation has proved particularly sticky, driven by persistent wage growth, global trade dynamics, and elevated food inflation from weather-related supply constraints....
Macroeconomic Insights: UK September 2025 CPI Analysis
UK CPI for September 2025 declined to 3.8% YoY, falling below market expectations of 4.0% (vs. Turnleaf estimate of 3.94%). The decline was primarily driven by sustained lower...
Macroeconomic Insights: Japan CPI – Subsidies Reset
Japan’s CPI over the next two months will be shaped by a mix of expiring and newly introduced subsidies. Over the past two years, national electricity and gas subsidies have...
Macroeconomic Insights: Australia CPI – Could Higher Unemployment Change Everything?
Turnleaf expects Australia's 12-month inflation forecast path to remain close to the Reserve Bank's upper bound 3% target range as stronger than expected demand continues to...
Macroeconomic Insights: China CPI — Will the Chinese New Year Be Enough?
China's headline CPI rose to -0.3% YoY in September 2025, still capped by food deflation and soft energy prices. Core CPI printed 1.0% YoY, above headline but still subdued as...
Macroeconomic Insights: United States CPI – Core CPI to Drive Inflation Trends
Core Goods and Core Services are steering U.S. inflation in the second half of 2025. According to Turnleaf’s U.S. inflation models, Core Goods will be driven by short-lived...