Featured Research
Macroeconomic Insights: Asia-Pacific Tries to Contain the Oil Shock
Across the Asia-Pacific, policymakers are throwing subsidies, tax cuts, reserve releases, and pricing controls at rising fuel costs in an attempt to delay or smooth an external energy shock from becoming a broader inflation problem (Figure 1). But that strategy is...
Macroeconomic Insights: Asia-Pacific Tries to Contain the Oil Shock
Across the Asia-Pacific, policymakers are throwing subsidies, tax cuts, reserve releases, and pricing controls at rising fuel costs in an attempt to delay or smooth an external energy shock from becoming a broader inflation problem (Figure 1). But that strategy is producing a clear divide. Some economies still have room to cushion the blow. Others remain highly exposed to imported energy, currency weakness, and second-round effects that policy can only delay, not eliminate.
Figure 1
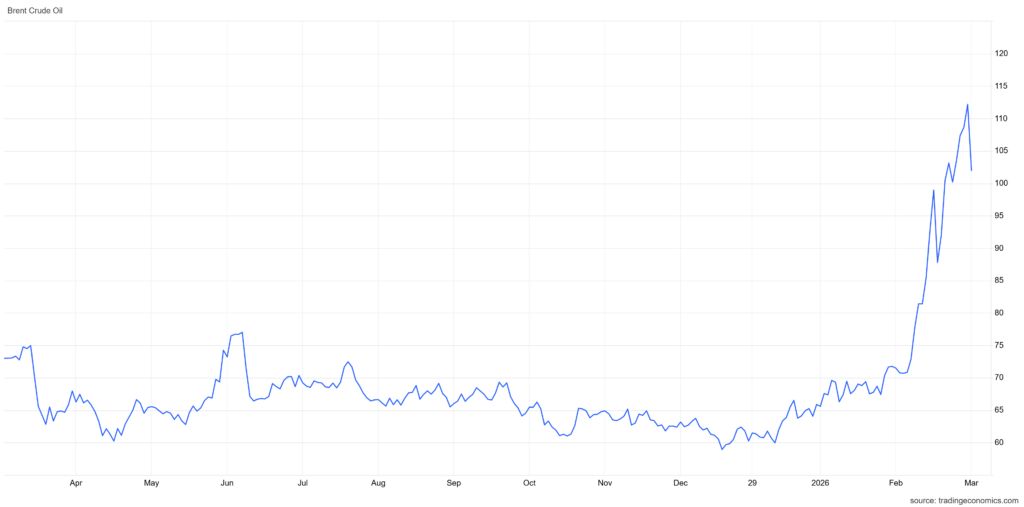
Figure 1 shows Brent crude following a similar trajectory, climbing from around $60–80 per barrel to above $115 in a matter of weeks. The speed and scale of both moves underline why the policy responses discussed below are being tested so aggressively across the region.
China — Most Administratively Controlled
China’s inflation curve looks relatively unchanged for now. While authorities have raised regulated ceiling prices for gasoline and diesel, they have also moved quickly to protect domestic supply, including an immediate ban on refined fuel exports in March. The broader point is that China still has more administrative control over domestic energy pricing than most peers, and that gives it a stronger capacity to contain first-round pass-through.
The risk is not so much an immediate retail fuel shock as a broader cost shock if elevated oil and gas prices persist long enough to spill into upstream production, logistics, and supply chains. In other words, China looks insulated in the short run, but not immune if the external shock becomes prolonged.
Indonesia — Fiscal Smoothing Still Doing the Work
Indonesia’s 12-month inflation forecast has shifted up materially, but the government is still using fiscal support and administered prices to keep the consumer impact from accelerating too quickly. Subsidized fuel prices have been kept unchanged, even as non-subsidized fuel prices were allowed to rise in March.
Additional buffers include unchanged electricity tariffs for April to June 2026, the possible revival of the B50 biodiesel programme, and a rice stabilization programme running from March through end-2026. The implication is that Indonesia remains exposed, but the state is still carrying much of the adjustment burden. As in Malaysia, that fiscal absorption comes at a cost, and the longer subsidies persist, the larger the quasi-fiscal transfer from government to consumers.
Japan — Inflation Pressure Is Rising Again
Japan is more complicated. Some easing in food price pressures has helped contain inflation, but that relief is increasingly being offset by higher energy costs and still-elevated staple prices, especially rice. In response to the oil shock, Japan has started releasing a record 80 million barrels from national reserves, even as average gasoline prices have climbed to a record ¥190.8 per litre. At the same time, the government resumed gasoline subsidies on March 19, 2026, initially subsidizing fuel at ¥30.2 per litre in an effort to push average pump prices back toward ¥170 per litre.
South Korea — Rising Expectations, Strong Policy Response
South Korea’s 12-month inflation forecast has also shifted up materially, with energy indicators pointing to stronger near-term pass-through. But, as in Japan, the policy response is active and aggressive. Authorities are leaning on a biweekly fuel price cap, sizeable oil reserves, and an extension of fuel tax cuts through end-April to suppress transmission.
Further buffers may come from higher nuclear and coal utilization, as well as additional support for vulnerable households. That should help contain the first-round inflation effect, but the move in inflation expectations is the real warning sign. Once expectations start moving, administrative containment gets harder. South Korea is still buffered for now, but shifting expectations are the key risk to that buffer, and the country is less comfortably positioned than the headline controls suggest.
To read the rest, visit our latest Substack post here.
Research Archive
Macroeconomic Insights: Colombia CPI: The Minimum Wage Shock
Colombia’s 12-month inflation outlook for 2026 has been revised higher. We now expect inflation to hit up to 6.7%YoY by the end of the year (Figure 1). This is a clear break from...
Macroeconomic Insights: Expect the Unexpected
Mark Carney at Davos, January 20, 2026 "For decades, countries like Canada prospered under what we called the rules-based international order. We joined its institutions, we...
Macroeconomic Insights: Eurozone CPI — “Sweater Weather” Is Repricing Energy Risk
Energy markets have moved back to the foreground as a near-term driver of Eurozone headline inflation. Colder January temperatures lifted heating and power demand into a winter...
AI coding is like making a burger with sugar
Have you ever had a burger, and then noticed something is kind of off. You’re hunting for the reason. Then it’s immediately obvious: they put sugar instead of salt. Ok, this has...
Macroeconomic Insights: Turkey CPI – Inflation Pinned in Gold
Gold jewelry remains a common wedding gift in Turkey, reflecting a cultural practice where households preserve wealth through physical gold rather than financial assets. This...
Macroeconomic Insights: US CPI – November’s Weakness is Not All December’s Gain
The October–November 2025 CPI sequence contained meaningful measurement distortions linked to the federal government shutdown. BLS has since confirmed that most CPI operations...
Macroeconomic Insights: Colombia CPI – Minimum Wage Shock Meets Fiscal Emergency
Turnleaf expects Colombia CPI to accelerate towards 6% YoY starting January 2026 following a 23.7% minimum wage increase that took effect on January 1—a significant upward...
Inflation Outlook 2026: New Year, New Inflation Regime?
Over the past year, global disinflation efforts have been complicated by escalating trade tensions that slowed global growth, geopolitical conflicts in the Middle East and...
Hundreds of quant papers from #QuantLinkADay in 2025
I tweet a lot (from @saeedamenfx and at BlueSky at @saeedamenfx.bsky.social)! In amongst the tweets about burgers, I tweet out a quant paper or link every day under the hashtag...
Macroeconomic Insights: U.S. CPI – Now What?
The October and November 2025 CPI prints were materially affected by technical distortions related to the federal government shutdown. These distortions are likely to produce a...
Macroeconomic Insights: What Drove US CPI Lower?
US CPI YoY NSA came in at 2.7%, significantly below consensus expectations (3.1%) and our own model forecast (3.0%). Core CPI YoY NSA also printed weaker at 2.6% versus market...
Macroeconomic Insights: Chile CPI – It’s Not All That Bad
Turnleaf expects Chilean inflation to ease below the central bank's 3% target in early 2025, driven by peso appreciation compressing import prices and subdued energy costs...
Macroeconomic Insights: US CPI – Natural Gas Price Dynamics and Inflation Pass-Through
The recent spike in natural gas futures reflects market expectations of future supply constraints. Unlike past volatility driven by weather alone, this increase stems from...
Macroeconomic Insights: Switzerland CPI – Inflation Not Hot Not Cold
Last month Turnleaf argued that Switzerland was escaping deflation but still stuck near 0% inflation over the next year, with any firming coming mainly from tax changes and...
Macroeconomic Insights: Australia Inflation Sparks Concern
Reaching 3.8% YoY in October 2025, headline CPI is currently above both the RBA's 2–3% target band and the market consensus forecast of 3.6% (ABS CPI October 2025). Turnleaf's...