
Harold Wilson once said a week is a long time in politics. He might have had the foresight to be referring to Liberation Day and the subsequent fallout into markets. One particular point that has been raised by many market participants is the recent fall in the dollar has been accompanied by a rise in US Treasury yields, which is typically not the behaviour we’d expect, ie. the market is selling the dollar and US Treasuries at the same time. I’ve seen comments on this in the FT as well as by Brent Donnelly and Jens Nordvig, my former Nomura colleagues recently amongst others. We’ve plotted this chart in Figure 1. It is slightly different from the FT chart, in that we are plotting EURUSD instead of DXY (although DXY is mostly made up of EURUSD), and we are using the yield differential, as opposed to purely UST 10Y yields, but the message of the recent divergence is still the same.
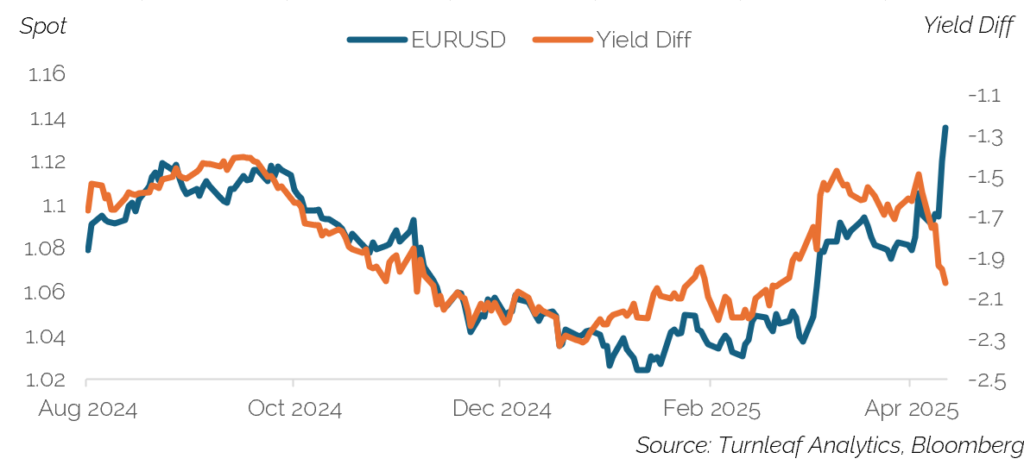
Figure 1 – EURUSD vs yield differentials recently
Typically FX market wisdom suggests that for developed markets rising yields tend to be accompanied by a strengthening currency. The rationale is that rising inflation, is likely to be accompanied by monetary policy tightening, given the market expects developed market central banks to be credible when it comes to maintaining their inflation targets. Hence, indicators of monetary policy expectations (eg. bond yields) will price in these hikes and rise. Of course, the same applies to falling inflation, and a more dovish central bank, tends to be accompanied by falling yields and a weakening currency. We thus see relative changes in yield differentials (between the base and the terms currency) as a proxy for monetary policy expectations.
Thus we might expect a correlation between spot returns in developed markets and changes in the rate differentials (FX is relative after all, so if we’re trading EURUSD we’d look at a rate differential of Eurozone sovereign bond yields – US Treasury yields). In emerging markets, this dynamic does not tend to hold. Typically, during periods of risk off, in EM, we might observe investors dumping the local currency and local bonds are the same time, so local bond yields can spike whilst the local currency weakens.
One of the most well known recent examples in developed markets was during Liz Truss’ brief premiership, this dynamic was seen in the UK, Gilt yields spiked higher and GBP sold off (Brent Donnelly has called this Trussification). It is important to note though, that this behaviour did not persist in the UK.
One question we want to answer is how often does this relationship flip between the dollar and changes in the yield differential? Is it really this unusual for the dollar and rate differentials to move in opposite directions? In our case we’ll look at EURUSD, given it’s the most liquid USD cross and a historical sample since 1999, when the Euro was introduced, up until 11 April 2025.
Various ways to quantify relationship between EURUSD and the rate differential
On a daily basis there is a positive correlation between EURUSD spot returns and the change in the 5Y differential of around 20% (see Figure 2). You can argue that daily data is noisy, plus the closing times of the various markets are not identical. One approach to alleviate this is to resample with monthly data.
If we resample to monthly data this long term positive correlation increases to 35%. On a monthly basis, regressing shifts in rates differentials versus spot returns on a contemporaneous basis results in an R-squared of 12%. In 67% of the months in our sample, the spot returns and rate differential changes were in the opposite direction. Another way to look at this is to plot the sign of the 20D rolling correlation with daily data (plotting the sign is easier to visualise than the very noisy rolling correlation). The vast majority of the time it is indeed positive (79% of the time). Interestingly in recent years, we see that the relationship is even stronger, but in many previous periods in the sample, we also see it flip relatively often, including during the large bull run in EURUSD in the 2000s.
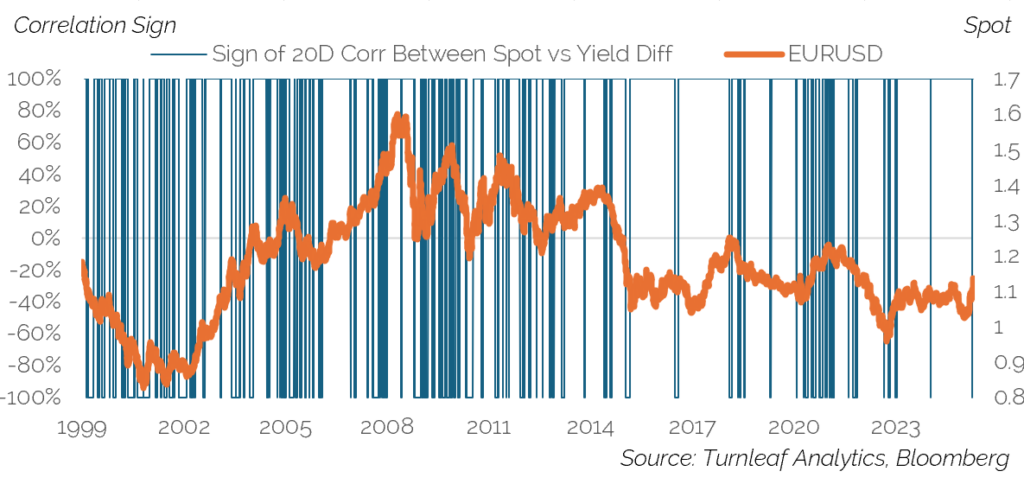
Figure 2 – Sign of daily rolling correlation between EURUSD and yield differential
If we want to focus specifically on large daily moves in EURUSD, we filter our data for the twenty days when EURUSD had its largest upside moves, and also its largest downside moves (see Figure 3). On those days we calculate the yield differential change. There are quite a few days when EURUSD rose and the rate differential fell, aside from during the last week in April 2025. Most notably some of these days occurred during severe risk off periods like the Lehman crisis and also COVID.
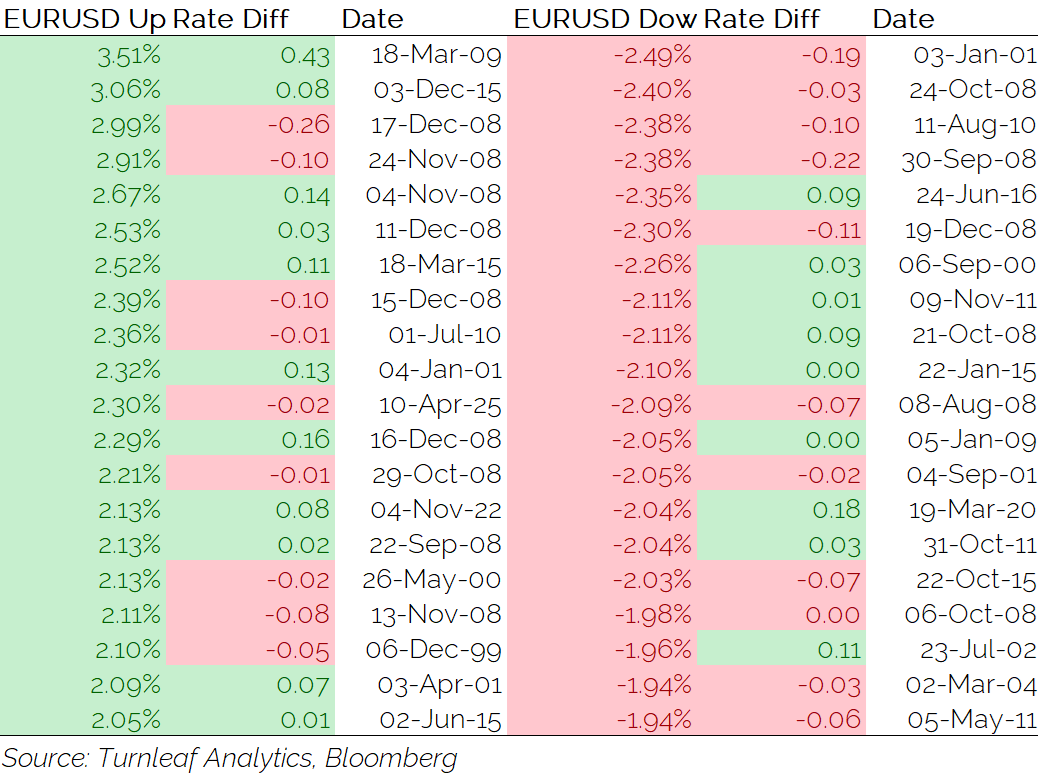
Figure 3 – Top twenty days for upside/downside EURUSD moves vs yield differentials
So what’s the conclusion? Yes, shifts rate differentials and EURUSD returns do tend to be correlated the majority of the time, which fits with common market wisdom. However, there are still a large number of times, when this relationship flips. We do observe during various risk off periods large moves in EURUSD accompanied by a “wrong way” move in yield differentials, in both directions.
Maybe this shouldn’t surprise us. Shifts in rate differentials are not the only driver of FX markets. Indeed, there are many common factors which people use for understanding FX which are not related to shifts in rate differentials (whether it is carry, trend, value etc.)
It does point to the fact that using rate differentials alone will not be sufficient to understand moves in developed FX markets more broadly. Indeed, we need to augment it with other data. Rather than relying purely on rate differentials to understand developed market monetary policy dynamics (and indeed trying to decipher the impact of tariffs), we can use timely and accurate inflation forecasts as part of our process. Furthermore we should try to understand potential future inflation dynamics across multiple points of the curve. The next print can be important, but so can further along the inflation forecast curve. The market is not always just trading the next CPI print.
At Turnleaf Analytics, we forecast inflation using machine learning models augmented with alternative data across both developed and emerging markets. We have also recently launched daily updated models for US CPI. We’ve developed a number of FX trading strategies as use cases for our inflation forecast. You can see the P&L updated for these trading modes on a monthly basis on our website. They have performed well out-of-sample/post publication.
Another way we assess the performance of these trading strategies (all DMFX) is by doing paper trading for some of them on Interactive Brokers. Looking at the P&L from our Interactive Brokers paper trading portfolio in early April 2025, it has performed well (see Figure 4), and the P&L has been far more stable than the very volatile stock markets. Admittedly this is just a short sample, but it is also the first major risk off test for the various DMFX trading strategies, since they were published to our clients. Also many other traditional quant strategies have not fared so well during this period, which suggests our inflation forecast data has additional orthogonal information, which are not captured by other quant strategies.
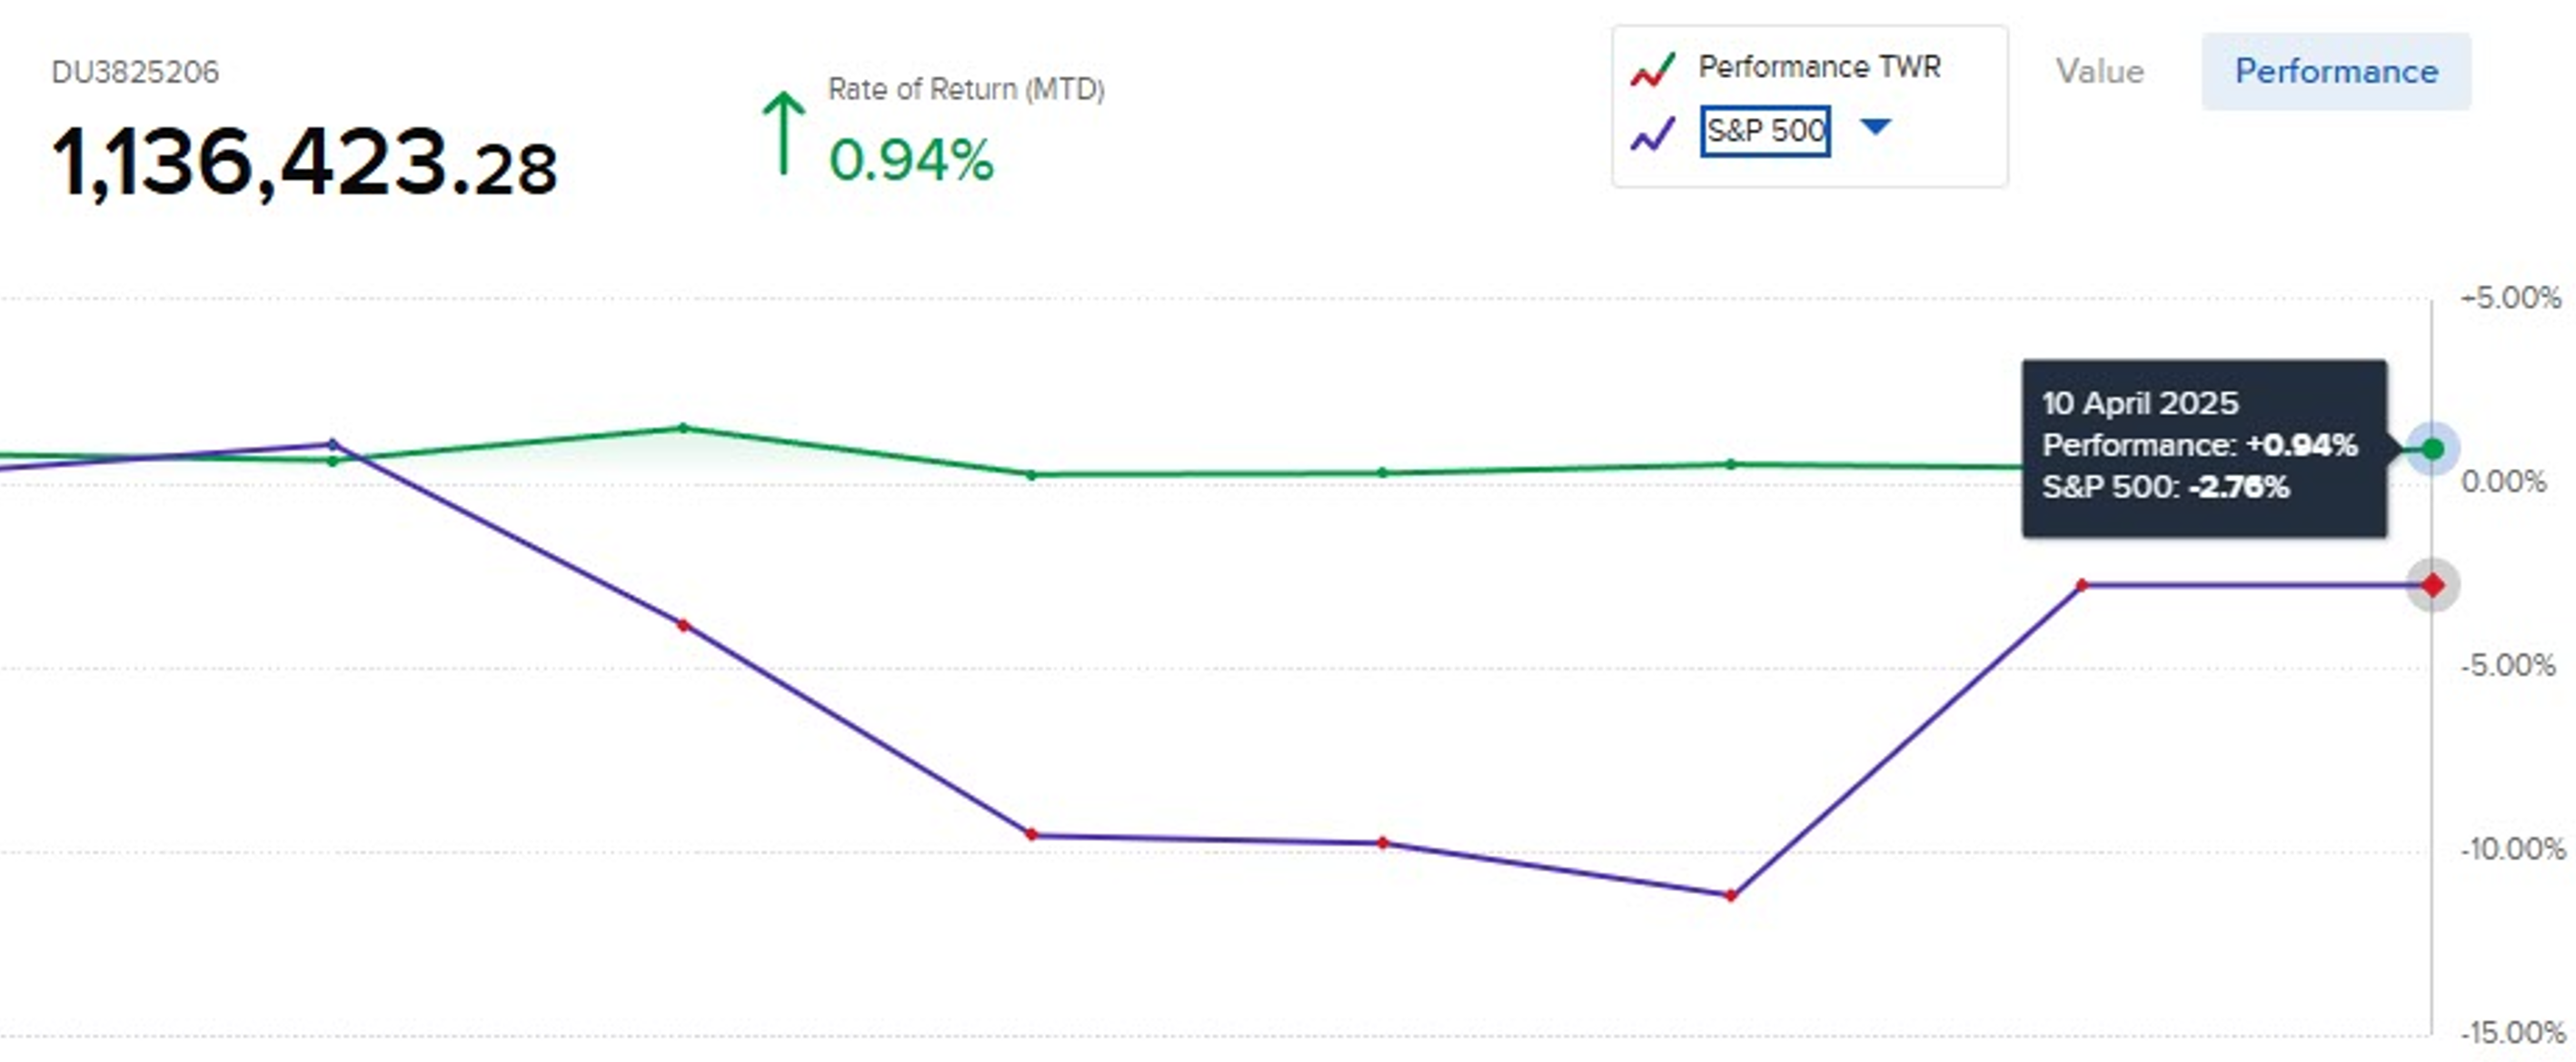
Figure 4 – P&L from Turnleaf Analytics trading strategies in April 2025
Conclusion
So in conclusion, the moves in the dollar lower and yields higher in early April 2025 have been unusual, but we would argue that they are not unprecedented as we have shown. Indeed, during other risk off periods we have seen large moves (both upwards and downwards) in EURUSD and “wrong way” shifts in rate differentials. During “risk off” market dynamics can flip in a counterintuitive way, for example, in 2009, I recall poor NFP data being accompanied by USD buying as “risk off” dominated the market. Clearly, if this happens repeatedly though, as opposed to occasionally, it would be a break from the historical norm, and we would really be in a new world, but we aren’t there yet.
The key point is that shifts in rate differentials, whilst important, are not the only drivers for developed FX markets and their relationship can flip. Rather than focusing purely on rate differentials as the only signal for understanding monetary policy expectations and as a way to trade FX, we should use other data such as timely and accurate inflation forecasts to augment our process for trading FX. This is of course not to say that inflation forecasts are the only driver for DMFX, but just an illustration that rate differentials shouldn’t be the only variable we look at.
If you’re an institutional investor and would be interested in Turnleaf Analytics forecasts, please contact us!