Featured Research
Macroeconomic Insights: Energy Price Pass-Through to Inflation
Brent crude has surged from ~$70 to above $100 following the US-Israeli strikes on Iran and the near-closure of the Strait of Hormuz (Figure 1). Dutch TTF natural gas has jumped from the low $30s to above $55/MWh in a parallel move (Figure 2). Contemporaneous (0) and...
Macroeconomic Insights: Energy Price Pass-Through to Inflation
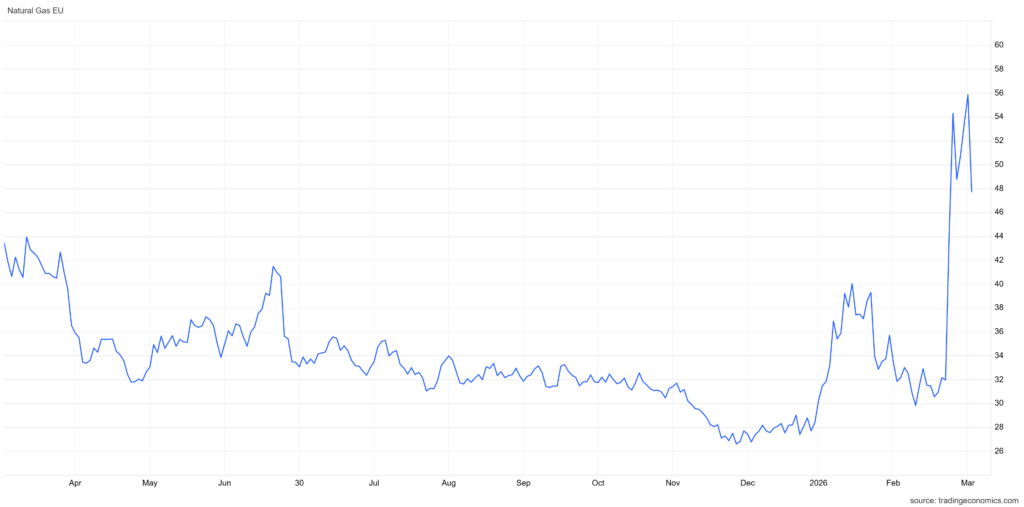
Brent crude has surged from ~$70 to above $100 following the US-Israeli strikes on Iran and the near-closure of the Strait of Hormuz (Figure 1). Dutch TTF natural gas has jumped from the low $30s to above $55/MWh in a parallel move (Figure 2). Contemporaneous (0) and lagged (1-12 month) correlations between these energy benchmarks and monthly CPI inflation across 36 countries reveal how differently this shock will propagate.
Figure 1
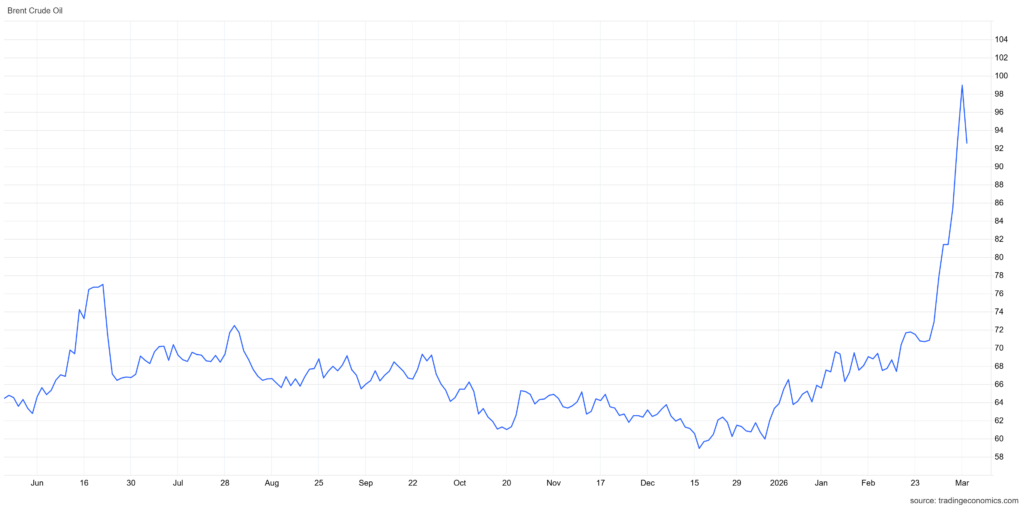
Figure 2
Oil hits the US fast. The Brent-CPI heatmap (Figure 3) shows the US peaking at lag 1, the strongest reading in the sample. US retail fuel prices are set by competitive markets with no administered pricing. Gasoline and motor fuel carry a combined CPI weight above 4%, and price changes at the pump flow into the index within one reporting cycle. The $30/bbl Brent move visible in the vertical spike in Figure 1 will register in March–April CPI prints almost mechanically. Canada, Thailand, and Malaysia show similar rapid pass-through profiles in Figure 3 for the same structural reasons.
Figure 3
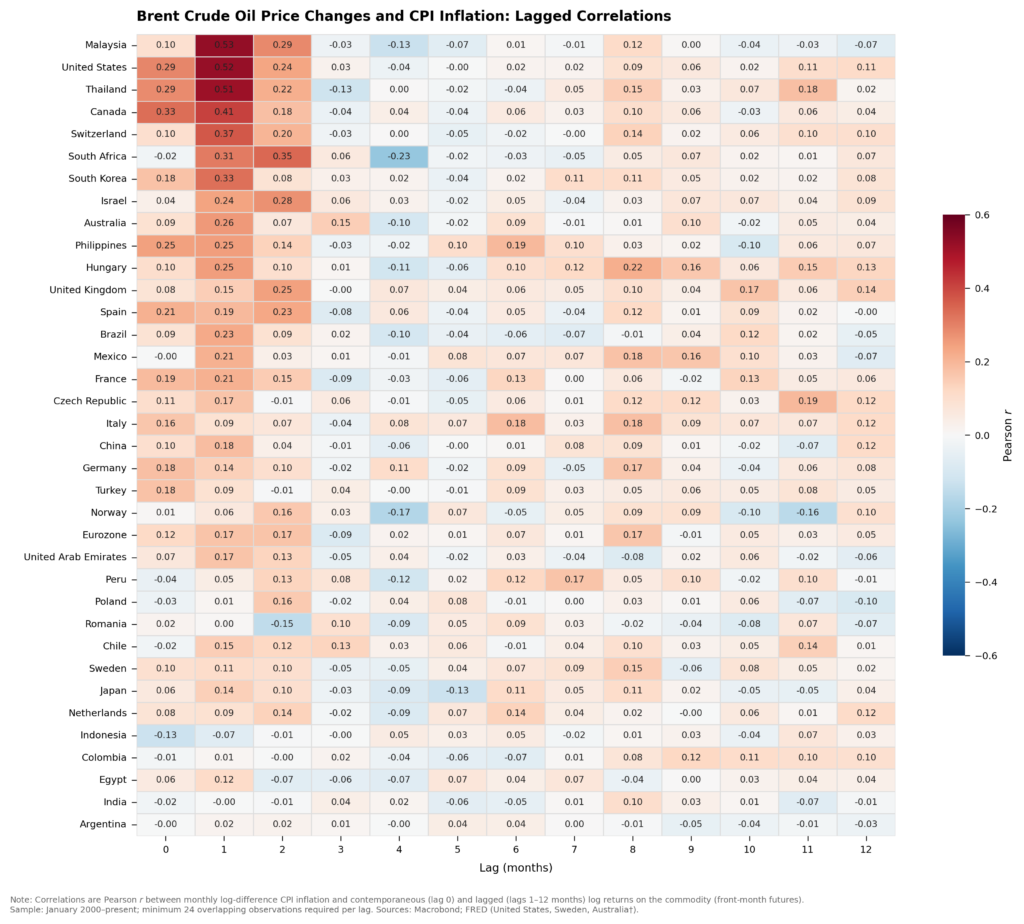
Europe’s oil response is muted by the tax wedge. The Eurozone row in Figure 3 peaks at lag 1 at roughly a third of the US equivalent. Fuel taxes (excise duties plus VAT) account for 50–65% of the retail price across France, Germany, Italy, and the Netherlands. Because excise duties are levied per litre rather than ad valorem, a doubling of crude translates into a far smaller percentage increase at the pump. Governments also retain the option to temporarily cut duties to absorb the shock, as France and Germany both did during the 2022 spike. The weak, diffuse colouring across the European rows in Figure 3 reflects this structural dampening.
The UK sits in between. Figure 3 shows the UK Brent-CPI correlation peaking at lag 2, reflecting Ofgem’s quarterly energy price cap. Wholesale energy cost changes are not passed to households immediately and instead, the cap is recalculated each quarter based on a backward-looking observation window. This regulatory structure introduces a built-in 1–2 quarter delay between a wholesale price spike and its appearance in CPI.
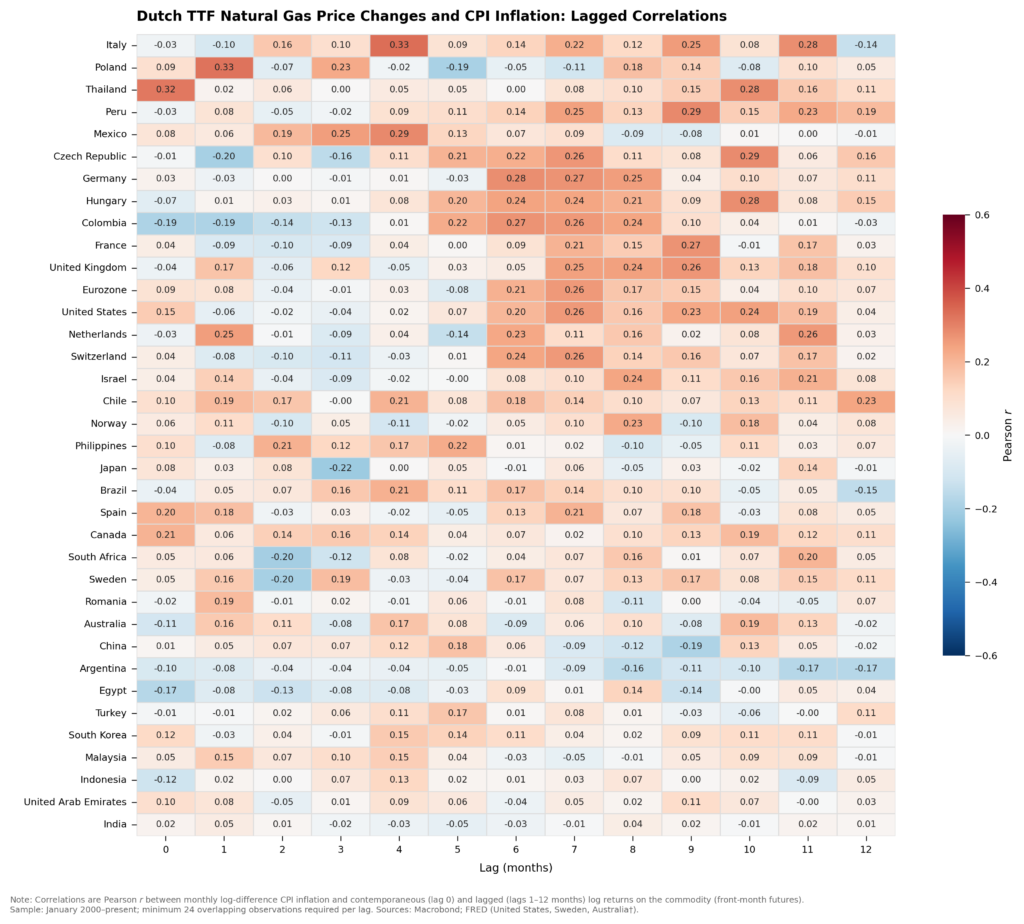
Gas is Europe’s real (delayed) vulnerability. The TTF-CPI heatmap (Figure 4) tells a strikingly different story from the Brent panel. European economies dominate the warm-shaded zone, but the peak correlations are concentrated at lags 5–8 for Italy, Germany, and the UK. Two primary mechanisms drive this delay. First, regulated utility tariffs in most European markets reset on fixed schedules (quarterly or semi-annually), creating discrete pass-through windows. Second, household heating costs depend on billing cycles and contract renewal dates, which vary by country but typically impose a 3–6 month lag between wholesale price movements and the consumer bill.
Figure 4
Implications on Turnleaf Forecasts
The spike visible in Figure 1 will produce a small near-term fuel price uptick dampened by the tax wedge (the muted European rows in Figure 3), while the spike in Figure 2 will drive a larger and more persistent gas-driven inflation impulse arriving in Q3–Q4 2026 as the strong lag 5–8 correlations in Figure 4 imply utility tariff resets, industrial cost pass-through, and heating bill adjustments feeding into CPI simultaneously. The Hormuz disruption is already feeding into our real-time inflation nowcasts via the proprietary alternative and high-frequency data we track across 36 countries, including daily shipping flows, port activity, and commodity prices.
The key factor to watch will be emerging regulatory intervention which will determine whether the historical pass-through coefficients hold or compress as they did in 2022 during the onset of the war in Ukraine. So far, several countries have already responded to higher energy prices:
- In the UK, Ofgem’s April–June price cap has already been set at £1,641, meaning households on variable tariffs are shielded from the current spike until at least July. However, Cornwall Insight’s forecast for the July–September cap has surged to £1,801, an increase of £160 on April’s level, driven by elevated wholesale gas prices. Each of these interventions will compress the historical pass-through coefficients documented in Figures 3 and 4, but only temporarily and at mounting fiscal cost.
- Hungary reimposed fuel price caps on Monday, with Orbán capping petrol at 595 forints per litre and diesel at 615 forints, alongside a release of state reserves.
- South Korea announced its first fuel price cap in 30 years, with President Lee Jae Myung ordering authorities to “swiftly introduce and boldly implement” a maximum price system for petroleum products. Seoul has also unveiled a 100 trillion won ($68.3 billion) stabilisation fund to subsidise energy costs for households and industry.
- China’s NDRC raised retail gasoline and diesel price caps by 695 and 670 yuan per metric ton respectively from Tuesday, the largest adjustment since March 2022, under its 10-working-day mechanism that links domestic prices to international crude. That mechanism includes a built-in ceiling at $130 per barrel, above which retail prices are generally frozen, meaning pass-through will cap out if Brent keeps climbing. Beijing also halted refinery exports of diesel and petrol on 5 March to preserve domestic supply.
Research Archive
Macroeconomic Insights: Measuring Inflation in Argentina Through Alternative Data
Just as Turnleaf has been applying alternative data to forecast inflation amid trade policy uncertainty, understanding Argentine inflation requires moving beyond conventional...
Macroeconomic Insights: Tariff Reprieves and Market Uncertainty — Implications for Inflation and Growth
Late last Friday, the U.S. administration announced exemptions for phones, computers, and chips from Trump's tariffs after imposing a 145% tariff against China – a large exporter...
The dollar, yields and inflation
Harold Wilson once said a week is a long time in politics. He might have had the foresight to be referring to Liberation Day and the subsequent fallout into markets. One...
Macroeconomic Insights: 90 More Days of Letting the Data Speak
Within hours of the large-scale tariffs taking effect, the Trump administration announced a 90-day pause, replacing the full tariff package with a baseline 10% rate. China—among...
Macroeconomic Insights: Tariffs Shock U.S. Inflation Expectations
The recent imposition of sweeping U.S. tariffs has triggered a sharp stock market selloff, erasing up to $2.5 trillion in market value. More importantly, this sell-off reflects...
Neudata 2025 London conference
I recently attended the Neudata conference on alternative data in London. I had last gone quite a few years ago, and I was pleasantly surprised about how much bigger the event...
Liberation Day Arrives – Market Prints Fall in Line with Turnleaf Expectations
Yesterday, President Trump announced a minimum 10% tariff on all imports into the United States, with higher rates targeted at countries running large trade surpluses with the...
Turnleaf Forecast Review: Recent Misses and Outcomes
This issue aims to clarify several of Turnleaf’s and the market’s forecast deviations over the past few months. Below, we outline key insights and performance drivers across a...
Macroeconomic Insights: India’s Inflation Paradox – Headline Drops, Core Rises
In recent forecasts, Turnleaf has observed an interesting trend in India’s inflation dynamics. While headline inflation has been trending downward, largely driven by a decrease...
Macroeconomic Insights: Polish Inflation – What Could Be, What Won’t Be in 2025
Recent retail sales in Poland have come in below expectations (-0.5%YoY in February 2025), with a significant decline driven by vehicle sales, followed by reduced consumption in...
Macroeconomic Insights: Mexico’s Inflation Path In Tariff Uncertainty Limbo
The tail of our inflation curve is currently driven by two key factors: U.S. tariffs set for April 2, 2025, and Plan Mexico, which aims to revitalize domestic manufacturing and...
Macroeconomic Insights: How Germany’s Fiscal Stimulus Could Reshape Its Inflation Outlook
Amid shifting geopolitical tensions and the need to revitalise its economy, Germany is preparing for a massive fiscal stimulus that will allocate up to $1 trillion in defence and...
Emerging Markets: Turnleaf Discusses Impact on Hungary’s 10% Profit Margin Cap Restriction on Inflation
Policy: In Hungary, from March 17 to May 31, 2025, a 10% profit margin cap will be imposed on 30 essential products, limiting companies' profits on these items. Small independent...
Macroeconomic Insights: U.S. Inflation is Coming, But Not Where You Expect
Since taking office, President Trump has aggressively worked to revitalize domestic manufacturing by focusing on the U.S. trade balance. A key part of this strategy has been...
Learning from running financial models live
Let's say you are the world's best burger chef (we all have ambitions, right). You'd be serving up all manner of burgers for your customers. It would be odd though, wouldn't it,...