Featured Research
Macroeconomic Insights: Airfares Take Off as Iran Conflict Continues
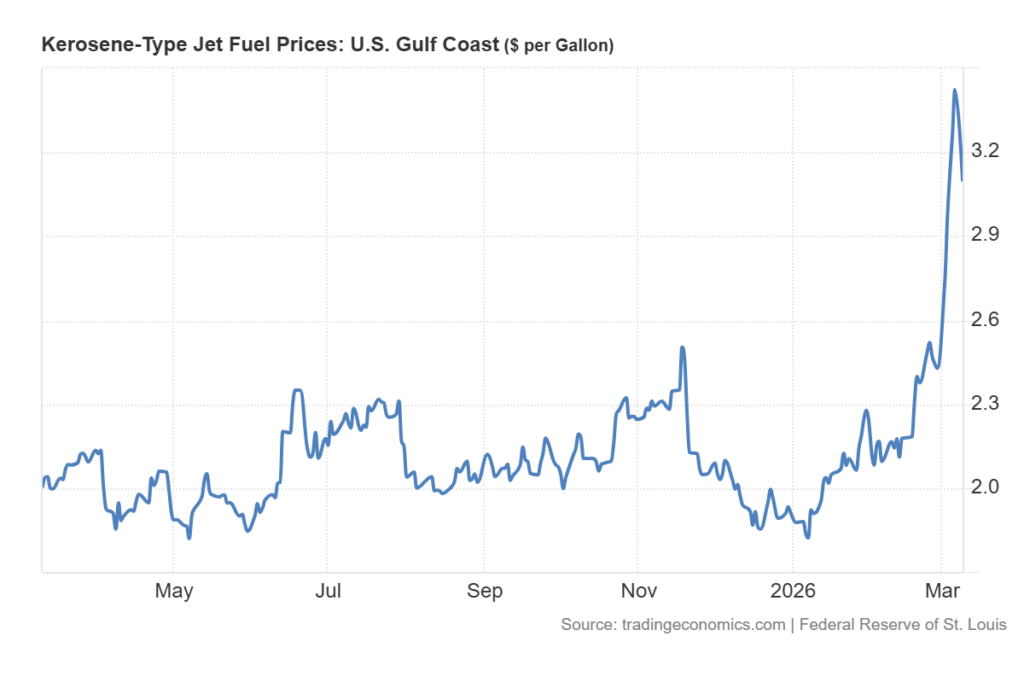
The war in Iran has persisted far longer than anticipated, driving sustained increases in global commodity prices. These pressures are now filtering into downstream products derived from crude oil, particularly jet fuel (Figure 1). As fuel costs rise, airlines are...
Macroeconomic Insights: Airfares Take Off as Iran Conflict Continues
The war in Iran has persisted far longer than anticipated, driving sustained increases in global commodity prices. These pressures are now filtering into downstream products derived from crude oil, particularly jet fuel (Figure 1). As fuel costs rise, airlines are facing higher operating expenses while demand for flights out of affected regions remains elevated. This combination of cost pressures and demand dynamics is pushing airfares higher.
Figure 1
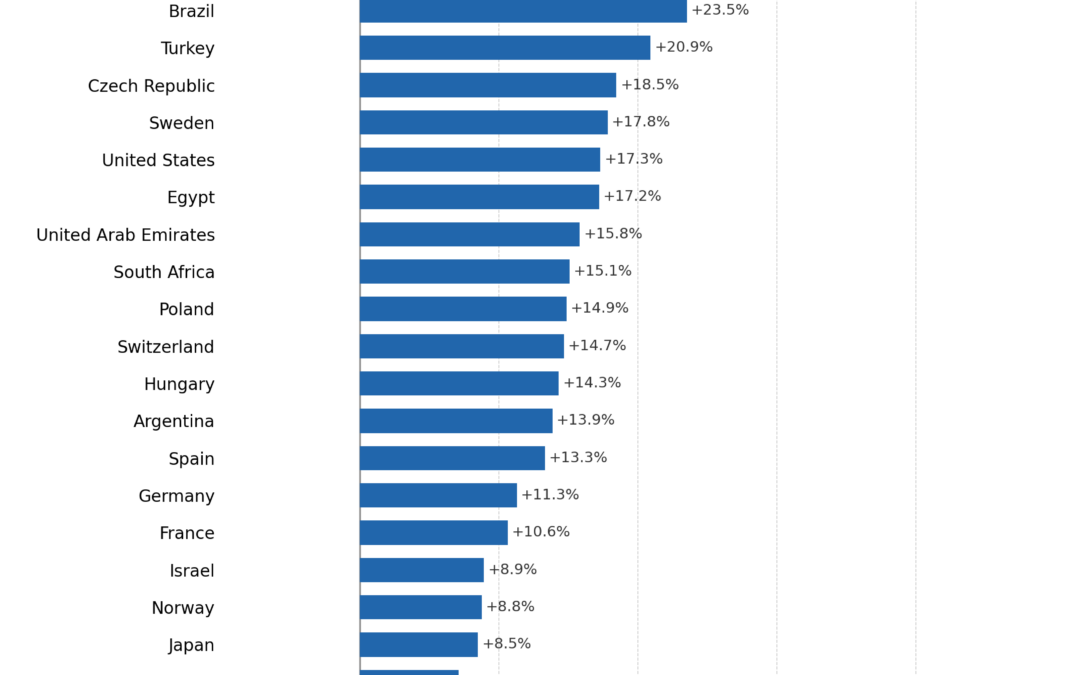
To quantify the rise in airfare prices, Turnleaf leverages its proprietary daily airfare index, which tracks thousands of ticket prices across 35 countries for travel within the next four weeks. As shown in Figure 2, fares increased by as much as 45% across markets between the last week of February 2026 and the week of March 18, 2026.
Figure 2
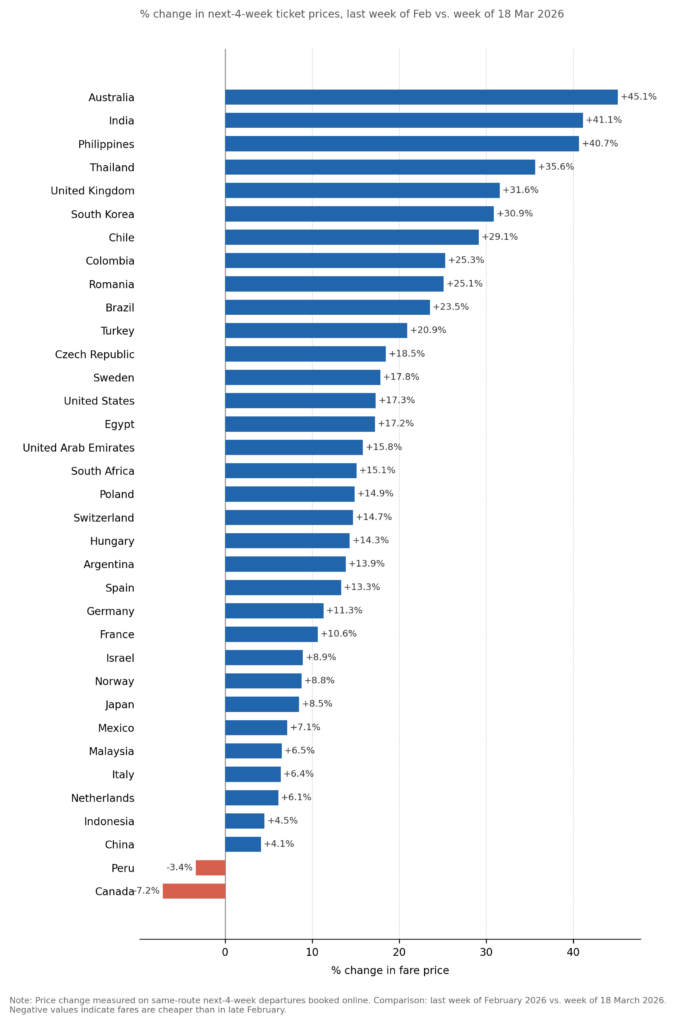
The dispersion across countries is substantial and reflects a combination of geographic exposure, network structure, and demand shocks. The largest increases are concentrated in Asia-Pacific markets such as Australia (+45%), India (+41%), and the Philippines (+41%), where long-haul dependency and limited substitution toward alternative transport amplify the pass-through of higher jet fuel costs. These markets are also more exposed to rerouting effects and capacity tightening as airlines adjust flight paths and schedules in response to regional instability.
In contrast, North America and parts of Europe show more moderate increases, with the United States (+17%) and core European markets largely in the 10–18% range. These regions benefit from more competitive airline markets, denser route networks, and a higher share of short-haul travel, which dampens price sensitivity to fuel shocks. Notably, Canada (-7%) and Peru (-3%) are outliers, suggesting localized demand softness or excess capacity that is offsetting upward cost pressures.
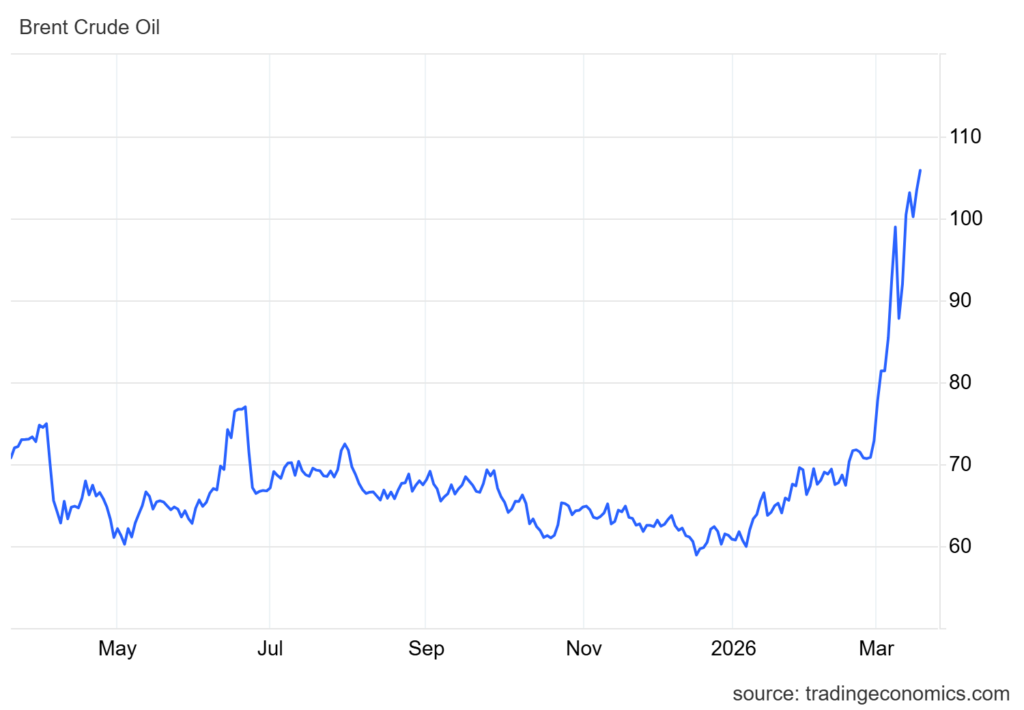
We will continue to monitor airfare dynamics as the conflict evolves. Upward pressure is likely to persist, with Brent crude approaching $110 per barrel and showing little indication of near-term relief (Figure 3).
Figure 3
Research Archive
Macroeconomic Insights: China CPI — Will the Chinese New Year Be Enough?
China's headline CPI rose to -0.3% YoY in September 2025, still capped by food deflation and soft energy prices. Core CPI printed 1.0% YoY, above headline but still subdued as...
Macroeconomic Insights: United States CPI – Core CPI to Drive Inflation Trends
Core Goods and Core Services are steering U.S. inflation in the second half of 2025. According to Turnleaf’s U.S. inflation models, Core Goods will be driven by short-lived...
WBS Training Palermo Conference 2025
Italy is made up of twenty regions, each of which is very different from another, from Veneto to Lazio to Puglia. Two weeks ago I visited Sicily. Perhaps unsurprisingly for an...
Macroeconomic Insights: United Kingdom CPI Gets a Boost
Turnleaf’s Oct 9, 2025 nowcast for September 2025 prints slightly higher than the Oct 1, 2025 weekly, reflecting a mix of policy and pricing signals that point to firmer levels...
Macroeconomic Insights: France CPI– Consumers are Waiting for Something Bad to Happen
Consumers are waiting for something bad to happen. Industrial weakness and worries about the government dominate the story, and French households are preparing for the worst. As...
Macroeconomic Insights: Poland CPI – The 2025 ‘Cheap Energy’ Party Winds Down
Turnleaf expects Poland’s CPI to average around 3% YoY over the next 12 months. By 2026, the base effects from the 2024 energy surge will fade, leaving food and services as the...
Macroeconomic Insights: South Africa CPI – Got Milk?
Turnleaf’s Headline CPI YoY forecast for South Africa has been revised lower following the unexpected August 2025 print of 3.3% YoY. The shift downwards of the inflation curve is...
Macroeconomic Insights: Hungary CPI Still Has a Long Way to Go
Turnleaf’s September 2025 headline inflation forecast for Hungary over the next 12 months points to an uptick toward 5% YoY by October 2025, followed by a steady decline into...
Macroeconomic Insights: Eurozone CPI – Services Keeping the Economy Running
At the start of 2025, tariffs posed a meaningful downside risk to Eurozone inflation. Yet Eurozone growth has proven more resilient than many expected. The potential loss of...
Gelato and accurate data in markets
I've been subscribing to the FT for many years. Primarily, I read it to keep track of financial markets. FT's longer form pieces complement having access to short articles on...
Macroeconomic Insights: Peru CPI – Seasonality Overshooting Inflation Forecasts
Since May 2025, Peru’s inflation has been consistently undershooting the forecasts of the central bank and economists. Figure 1 shows successive BCRP forecast vintages for...
Macroeconomic Insights: Philippines CPI – Fish Takes a Bite Into Inflation
For the past few months, we have seen our forecasts for the Philippines adjust upwards as the central bank pivots from inflation-defensive to disinflation-offensive. Our...
Macroeconomic Insights: Colombia CPI — Understanding Prices Through the Media
In Colombia, almost 17% of the consumer price basket are administratively set. This includes household public services, transport, fuel, and education fees. The legislation...
Macroeconomic Insights: Energy Prices —The Arbiter of Czech Republic CPI
Turnleaf expects Czech CPI to fall close to 2% YoY by the end of 2025 and then float back up towards 3% YoY through 2026. In the short term, our model places greater weight on...
Macroeconomic Insights: What’s on the Inflation Menu? – Turnleaf’s Food Index Catalogue
In Spain, it’s jamón. In Italy, Parmigiano Reggiano. In Japan, fresh fish. Every country has its culinary treasures, but when the prices of these beloved staples rise, the...