Featured Research
Macroeconomic Insights: Where Will the Oil Shock Hit Next?
Turnleaf reads the current inflation data as a test of duration. Fuel prices have lifted headline CPI, while core has stayed contained because energy prices have not remained elevated long enough to force broad repricing across non-energy goods and services. Current...
Macroeconomic Insights: Where Will the Oil Shock Hit Next?
Turnleaf reads the current inflation data as a test of duration. Fuel prices have lifted headline CPI, while core has stayed contained because energy prices have not remained elevated long enough to force broad repricing across non-energy goods and services. Current pricing assumes the conflict ends before inventories, reserve releases, tax cuts, and price caps lose their ability to absorb the shock.
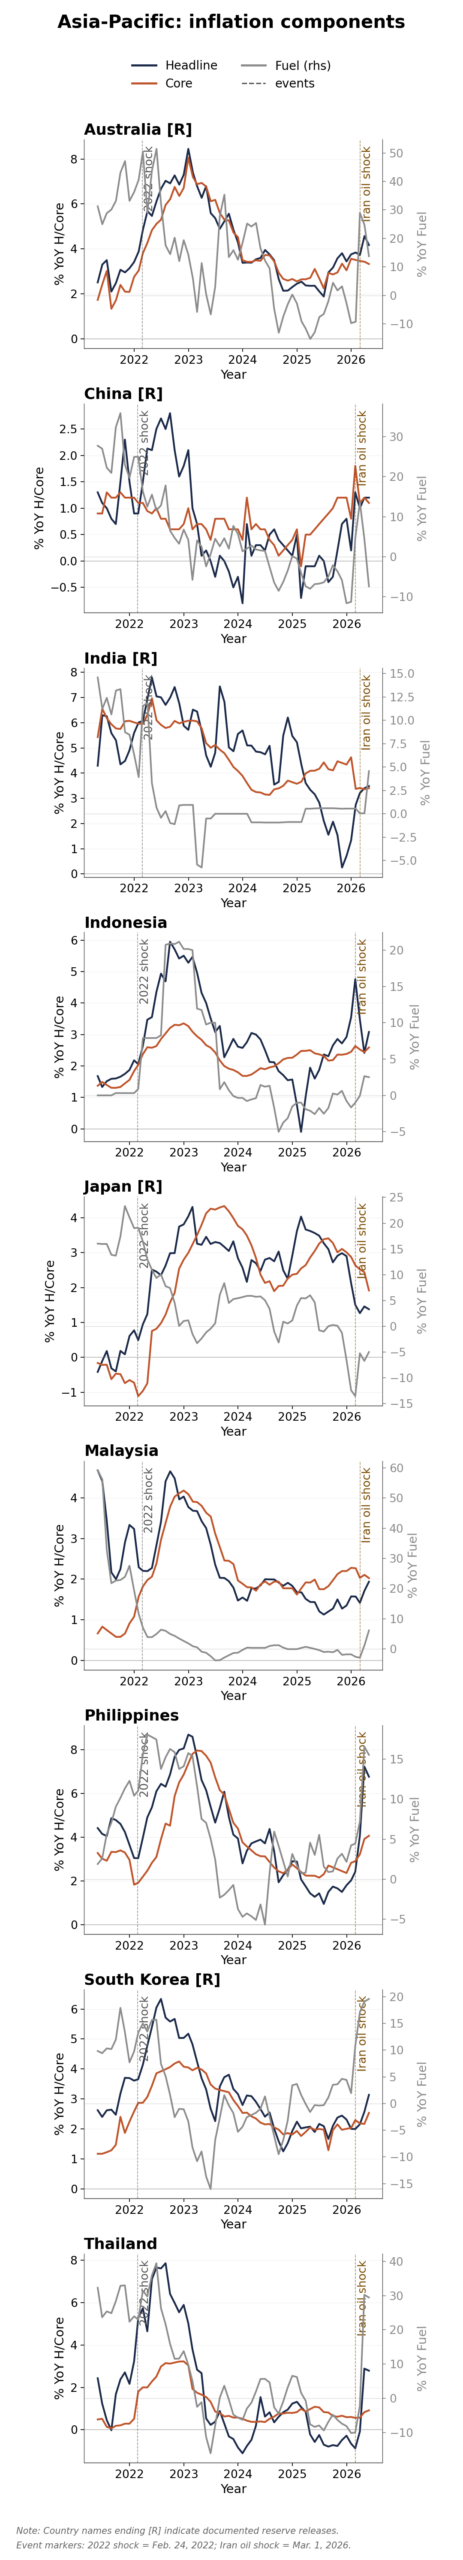
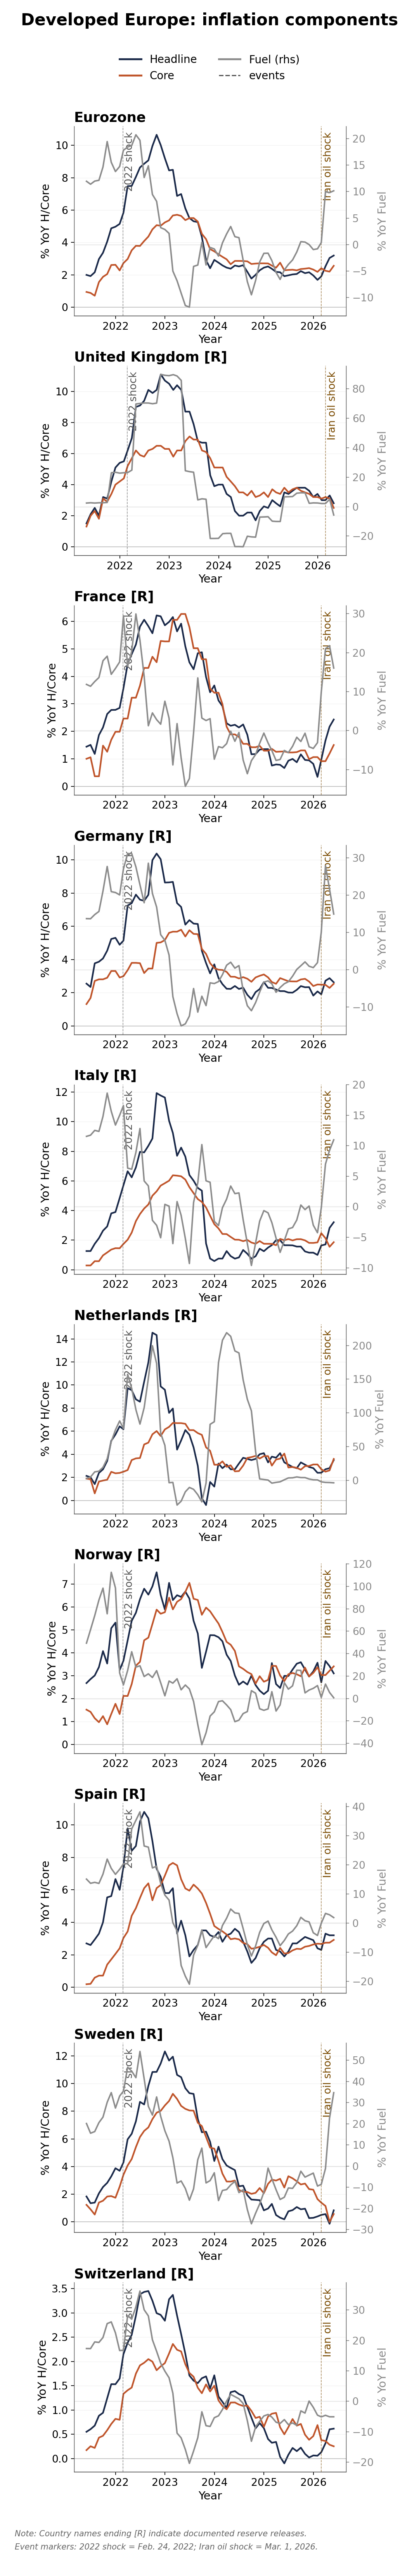
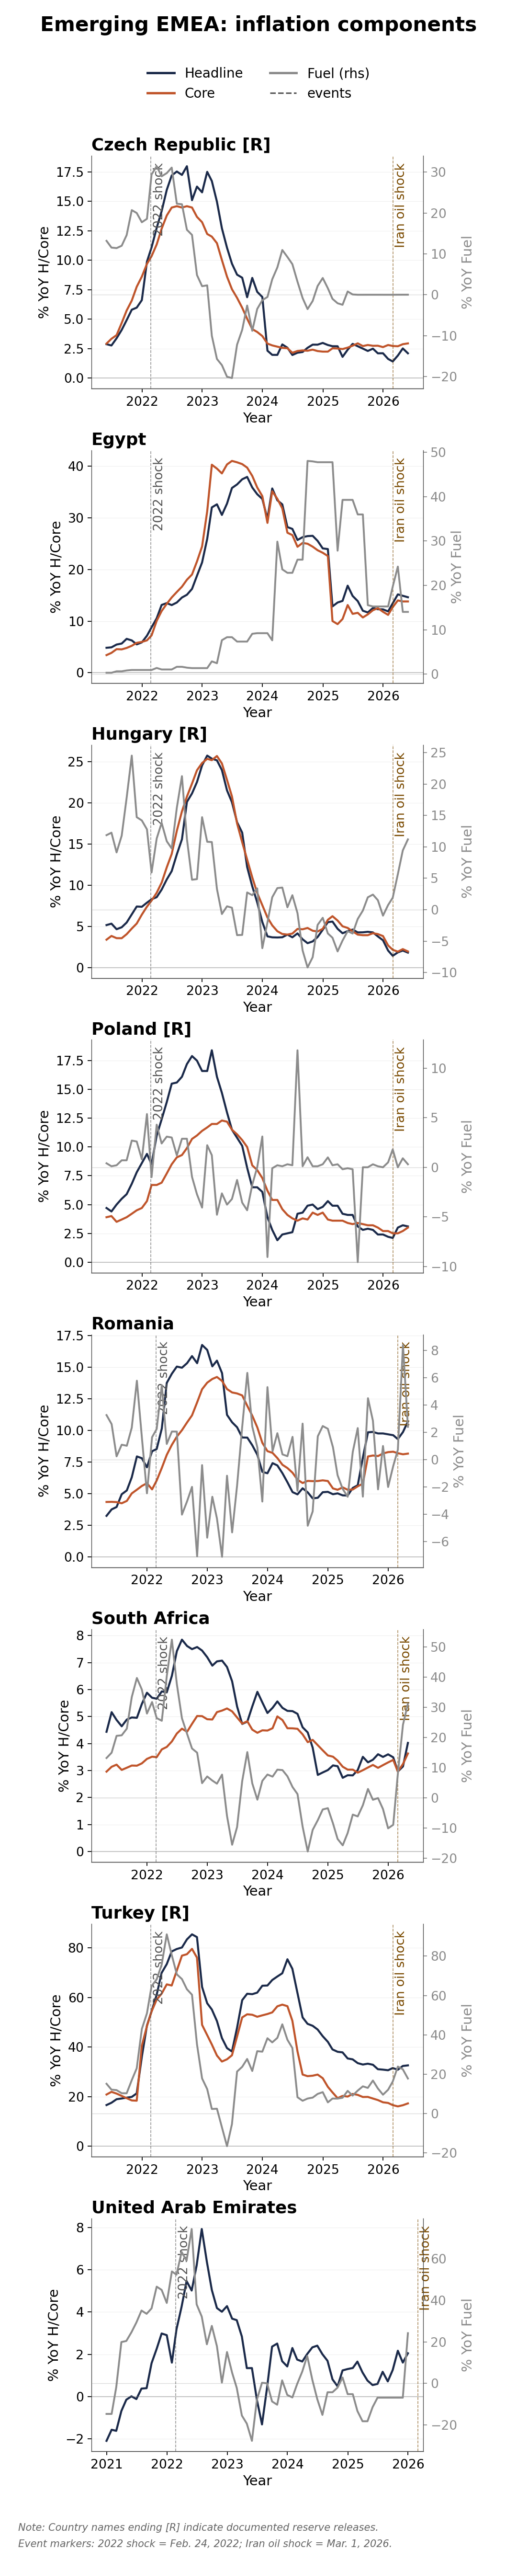
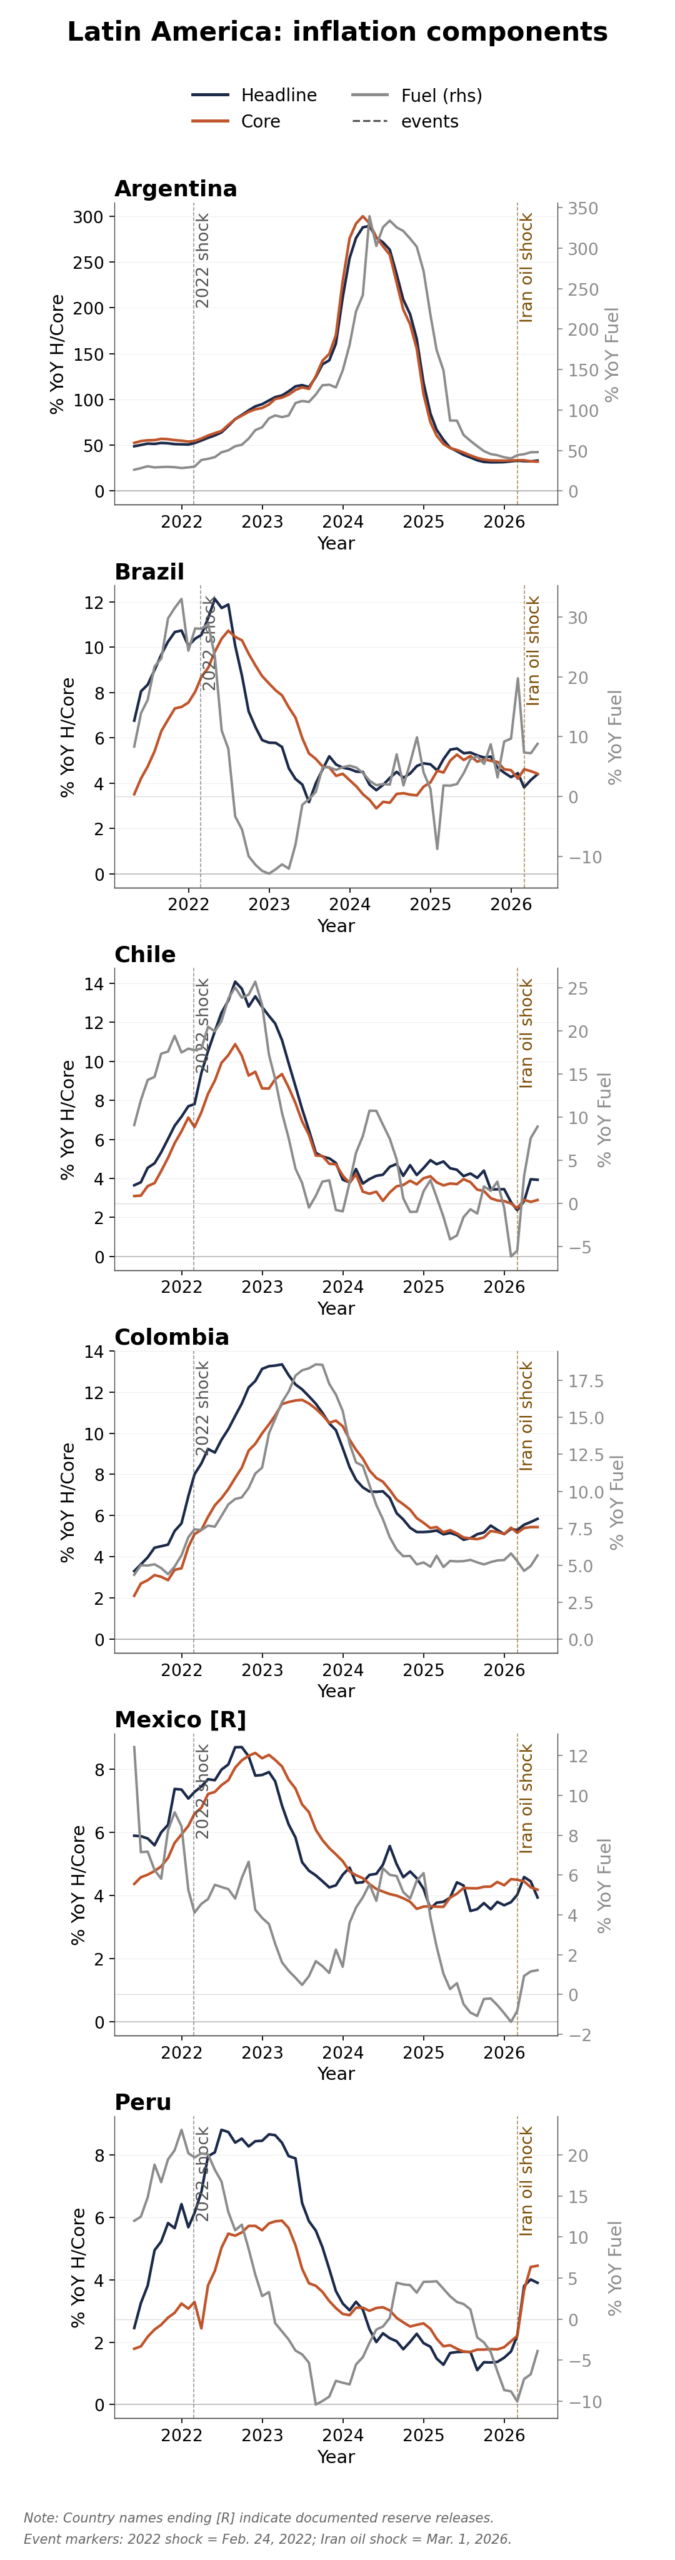
The inflation component panels frame the shock through that lens. Fuel prices have turned higher across several regions since the Iran shock marker, but headline and core have not moved in a uniform way. In the net oil-importing or fuel-exposed economies of Asia-Pacific, the renewed fuel impulse appears alongside more visible headline re-acceleration. Developed Europe shows a more uneven response because tax wedges, retail interventions, and regulated prices dampen the first pass-through. Emerging EMEA looks relatively benign in some headline and core series, although the fuel lines and policy setting suggest suppressed pressure rather than full insulation. Latin America remains more insulated among the larger energy and commodity-producing economies, while Chile and Peru look closer to the oil-importer cases. The United States occupies an intermediate position, with fuel inflation rising and headline following, while producer income, restrictive policy, and earlier goods disinflation have so far limited the move into core.
The comparison with 2022 helps frame the timing. In the earlier shock, fuel moved first, headline followed, and core adjusted later as energy costs interacted with reopening demand and tight labor markets. The 2026 setting is less straightforward. Core inflation has already fallen from its peak, monetary policy remains restrictive, and markets have more reason to assume that firms cannot pass through every cost increase. That backdrop makes the current shock more dependent on persistence than on the initial fuel spike alone.
Market pricing appears consistent with an assumption that the conflict will end before the shock crosses that persistence threshold. Under that view, fuel can lift headline inflation for a period without remaining high enough to reset freight contracts, airfares, food production costs, petrochemical inputs, packaging costs, utilities, and other prices inside core. Turnleaf’s disagreement concerns the durability of the shock and the buffers absorbing it. The first-round fuel move is already visible. The open question is whether those buffers last long enough to prevent broader repricing across non-energy goods and services inside core.
Asia-Pacific shows the strongest net oil-importer and fuel-exposure pressure, with renewed headline acceleration in several economies near the Iran shock marker. In country labels throughout the figures, [R] identifies documented reserve releases.
Figure 1
Developed Europe shows a more uneven fuel impulse because tax wedges, retail interventions, and regulated prices dampen the first move.
Figure 2
Emerging EMEA shows headline and core prints that look benign in some countries, but the fuel lines suggest that policy and pricing arrangements have suppressed part of the shock.
Figure 3
Latin America remains more insulated among the larger energy and commodity-producing economies, while Chile and Peru look closer to the oil-importer cases.
Figure 4
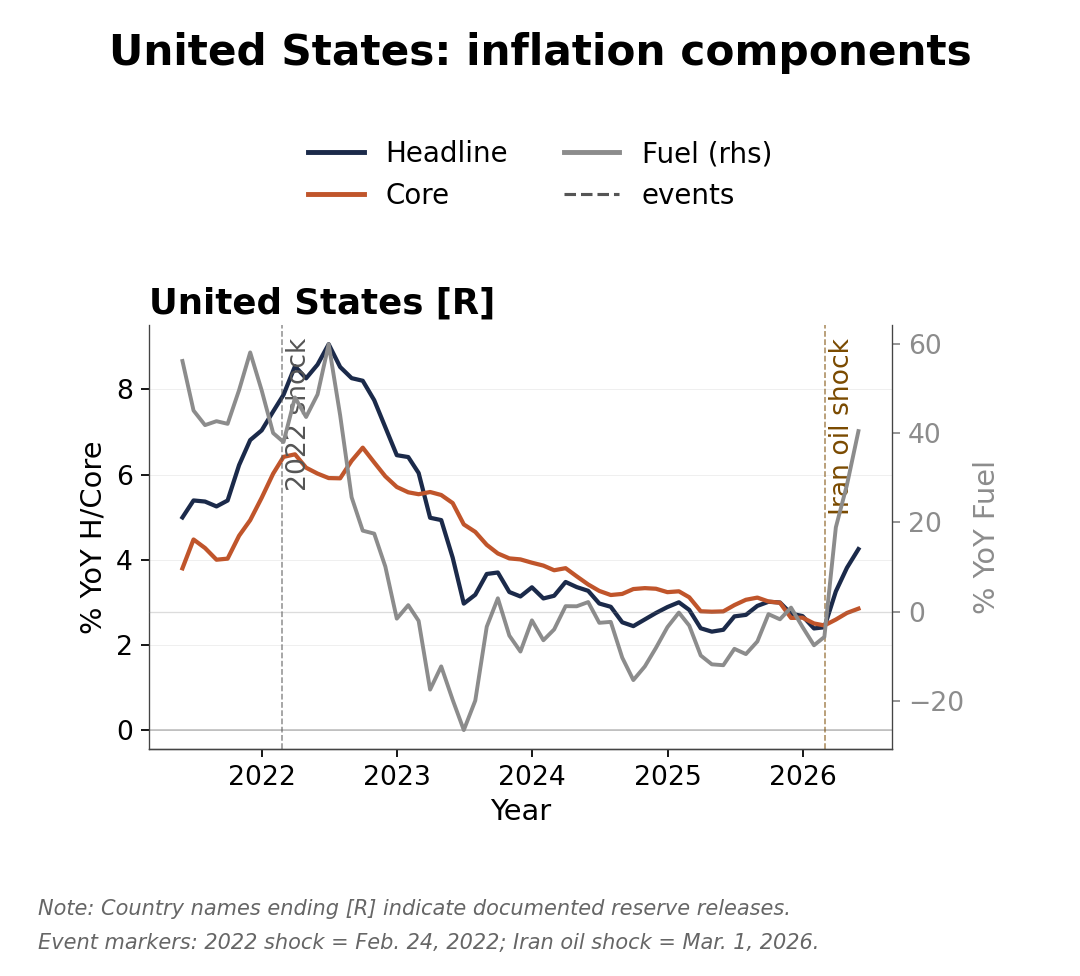
The United States occupies an intermediate position between the net oil-importing or fuel-exposed cases and the producer economies. Fuel inflation has increased and headline inflation has followed, while core inflation has remained comparatively contained. Producer income, restrictive monetary policy, and earlier goods disinflation have slowed the transmission into core. The U.S. figure therefore speaks less to immediate pass-through than to timing. It shows a first-round fuel shock whose broader core effects remain contingent on the duration of the conflict and the erosion of inventories, fiscal buffers, and pricing restraint.
Figure 6
Reading the fuel panel
The fuel-tax panels explain why headline inflation has remained relatively benign in several countries despite the common oil shock. A higher crude price reaches CPI only after passing through the pump-price system, where tax policy, subsidies, and retail caps determine how much of the global product-price move households actually pay. The labels in each panel report the CPI weight of petrol or diesel and the latest contribution to headline inflation, so they show both the retail price move and the share of the consumption basket exposed to that move.
The 2026 drop in fuel-tax shares shows the policy buffer most clearly. In developed Europe, petrol and diesel fuel-tax shares fall sharply in Spain, Germany, Italy, France, Sweden, and the euro area aggregate, with the series capturing excise and VAT or sales tax effects where applicable. Those cuts reduce product-cost pass-through at the pump, which helps explain why headline inflation has not moved as much as the crude shock alone would imply. Spain gives the clearest example. Petrol carries a 2.28 percent CPI weight but adds only 0.03 percentage points to headline inflation, while diesel carries a 2.44 percent weight and adds 0.32 percentage points. Petrol looks contained because policy has absorbed much of the shock. Diesel still matters because it feeds freight, farming, construction, and distribution.
To read the rest, visit our latest Substack post, here.
Research Archive
Macroeconomic Insights: How U.S. Tariffs and Eurozone Weakness Are Shaping Chinese Inflation
The trajectory of Chinese inflation will largely depend on its sensitivity to U.S. tariffs and its ability to sustain domestic GDP growth through external demand, particularly...
Macroeconomic Insights: Prices to Increase in February 2025 as Canada’s Tax Holiday Takes a Holiday
Between mid-December 2024 and mid-February 2025, the Canadian government implemented a GST/HST tax holiday, exempting beverages, restaurants, children’s clothing and footwear,...
Macroeconomic Insights: Fueling the Inflation Fire – Turnleaf’s Turkish Inflation Curve Shifts Upwards
Turnleaf’s latest data has pushed Turkey’s inflation outlook higher than consensus forecasts. There are multiple reasons for this which we will explain in this note. One of the...
Macroeconomic Insights: Assessing the Inflationary Impact of U.S. Steel & Aluminum Tariffs
The newly announced 25% tariff on U.S. steel and aluminum imports introduces cost pressures across global supply chains. However, the key question is not just how markets react,...
Emerging Markets: January 2025 Colombia and Hungary CPI YoY Forecast Review
2025 Colombia CPI YoY Above Consensus Due to Global Inflation Pressures Turnleaf’s CPI YoY model projects Colombia inflation well above consensus 12 months out, as it more...
Emerging Markets: January 2025 India CPI YoY Forecast Review
In our January 2025 YoY CPI forecast, we projected inflation at 4.57%, slightly above the realized 4.3%, yet outperforming consensus (4.71%)—even with our estimate released a...
Macroeconomic Insights: 2025 Eurozone Inflation Outlook – 4 Key Charts to Watch
Turnleaf is forecasting 2–2.5% headline inflation for the Eurozone in 2025, while core inflation is expected to decline through the end of the year towards 2% as momentum in wage...
DeepSeek, objectives and constraints
When a new burger joint opens up, there's often a buzz. Everyone (well, at least me) wants to try the new burger. Is it as good as it looks on Instagram? Or is it just style over...
Hundreds of quant papers from #QuantLinkADay in 2024
I tweet a lot (from @saeedamenfx and at BlueSky at @saeedamenfx.bsky.social)! In amongst, the tweets about burgers, I tweet out a quant paper or link every day under the hashtag...
What we’ve learnt from reading thousands of Fed communications
We recently had the last FOMC decision of 2024. Market l participants reacted to the hawkish tone including Powell’s comments that the Fed’s year-end inflation projection has...
Flash Inflation Outlook: The Cost of Stability, Poland’s Extended Energy Caps
The Polish government’s decision to extend the cap on electricity prices at 500 PLN/MWh is a critical measure to limit inflationary pressures on households. To understand its...
Macroeconomic Insights: A Pinch of Real Rates, a Dash of Slack: Turnleaf’s 2025 U.S. Inflation Recipe
At Turnleaf Analytics, leveraging our machine learning models, we project U.S. inflation to stabilize between 2–3% through 2025, shaped by the interplay of import inflation,...
Macroeconomic Insights: Rising Costs Hit Germany Where It Can’t Afford It—Manufacturing
Germany, long regarded as Europe’s economic powerhouse, owes much of its success to its export-driven industrial base. However, recent years have seen this foundation weaken...
Macroeconomic Insights: France’s Inflation Outlook Amid Fiscal and Economic Pressures
France’s inflation remains near the European Central Bank’s (ECB) 2% target despite significant fiscal spending during the pandemic and in response to the war in Ukraine....
Flash Inflation Outlook: South Korea Inflation Amid Political Instability
South Korea’s brief declaration and subsequent revocation of martial law by President Yoon has damaged investor confidence, further weakening the won and placing pressure on the...