On April 28, 2025, at approximately noon, I couldn’t send a message to a colleague. I thought there must have been a problem with my WIFI, until I realized that none of the lights were working either. Within an hour, thousands of confused employees walked out of their office buildings after being told to leave for the day. The entire Iberian Peninsula was in a black out –no electricity, no Internet, no cell service. But the day was beautiful – warm and sunny — and as long as I had a few euros in my pocket, today was the perfect day to spend money on a couple of beers.
Word Cloud Contribution Plot, Eurozone, March 2025 MoM
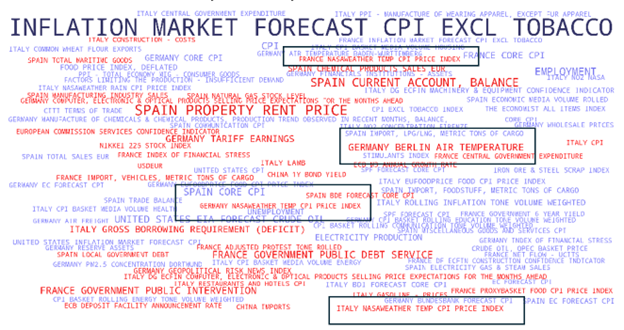 When we run our forecasts, we try to cover data that best reflects all components of CPI. High frequency price data on leisure, entertainment, and culture is difficult to come by. But weather data is much easier to access and is often strongly correlated with the way consumers spend their money. Towards the end of April 2025, the weather had gotten warmer across the Eurozone with our models picking up increases in leisure prices given a rise in the region’s air temperature. In our April 25, 2025 weekly nowcast, information reflected by indicators like Germany Berlin Air Temperature and Italy, France, and Germany NASA Weather Temp CPI Price Index, which correlate with higher inflation pressure, serve as a competitive advantage over the inflation market (TL 0.54 vs Market 0.43 vs Realized 0.56 MoM).
Word Cloud Contribution Plot, Eurozone, April 2025 MoM
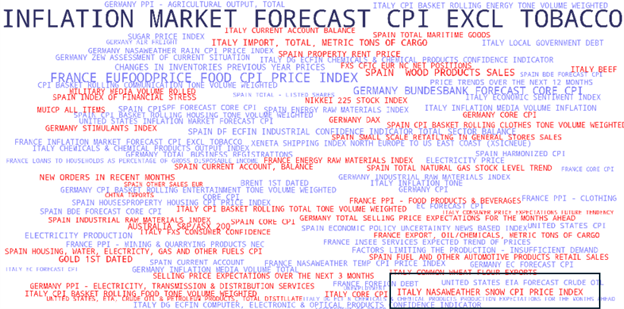 For our May 2025 forecast, there’s a different weather story. On April 18, 2025, a sudden snowstorm affecting the Alps region prompted some high-altitude ski resorts to reopen some trails for the weekend. These sudden events— which push leisure prices above normal seasonal patterns—often get masked by standard seasonal adjustments when not explicitly modeled. Our model was able to recognize the unexpected shift in Italy’s NASA Weather Snow CPI Price Index, which placed upwards pressure on our inflation print for the Eurozone for May 2025.
Alternative data has become an essential part of Turnleaf’s strategy to detect abrupt shifts in price dynamics. By incorporating high-frequency, granular weather data, we can directly capture and adjust for these shocks to leisure demand. In light of our recent forecast, Turnleaf expects inflation to remain around 2% for the next 12 months.
Subscribers can gain insights into the key drivers influencing Turnleaf’s CPI forecasts by examining our Word Cloud. Each term represents an economic indicator’s relative importance in our CPI model. The size of each word reflects its contribution magnitude to overall inflation predictions, helping subscribers quickly identify the most influential factors. The color coding further clarifies each indicator’s impact direction: blue words represent indicators with a disinflationary effect on CPI, while red words highlight inflationary factors. For instance, ‘Inflation Market Forecast’ is large, indicating their significant weight in the model, while its color suggests whether it contribute to higher or lower inflation trends. This Word Cloud enables a quick, visual analysis of the complex landscape of inflationary and disinflationary influences in our forecasting model.