
Chinese headline CPI rose 0.5% YoY in July 2026, with core inflation at 0.9%, leaving the January to July average at just 0.9% against an official target of around 2%. The food, tobacco and alcohol category and residence account for 51.6% of the basket between them and both remain in deflation, while the few categories lifting the headline are either policy-driven or unusually concentrated. Those conditions keep underlying price pressure weak, and Turnleaf’s 11 August 2026 vintage holds inflation at or below 1% throughout the twelve-month horizon. The path has also shifted materially lower since June, with the October peak falling from roughly 1.6% in our 11 June vintage to about 1.0% now, a downward revision of around 0.6 percentage points (Figure 1 – to gain access to Turnleaf’s latest China inflation forecast, visit our latest Substack post, here.).
The composition of the index helps explain why the headline has so little momentum. More than half of the inflation that remains can be traced to three identifiable sources. China Merchants estimates that gold adds 0.20 percentage points to 2026 CPI, medical services pricing reform 0.10 and the consumer goods trade-in programme 0.18. Together they contribute roughly 0.48 percentage points against a January to July headline average of 0.9%, implying that consumer prices outside those effects are running closer to 0.4%. All three contributions should fade over the forecast horizon, leaving a much softer underlying inflation rate into 2027.
Figure 2
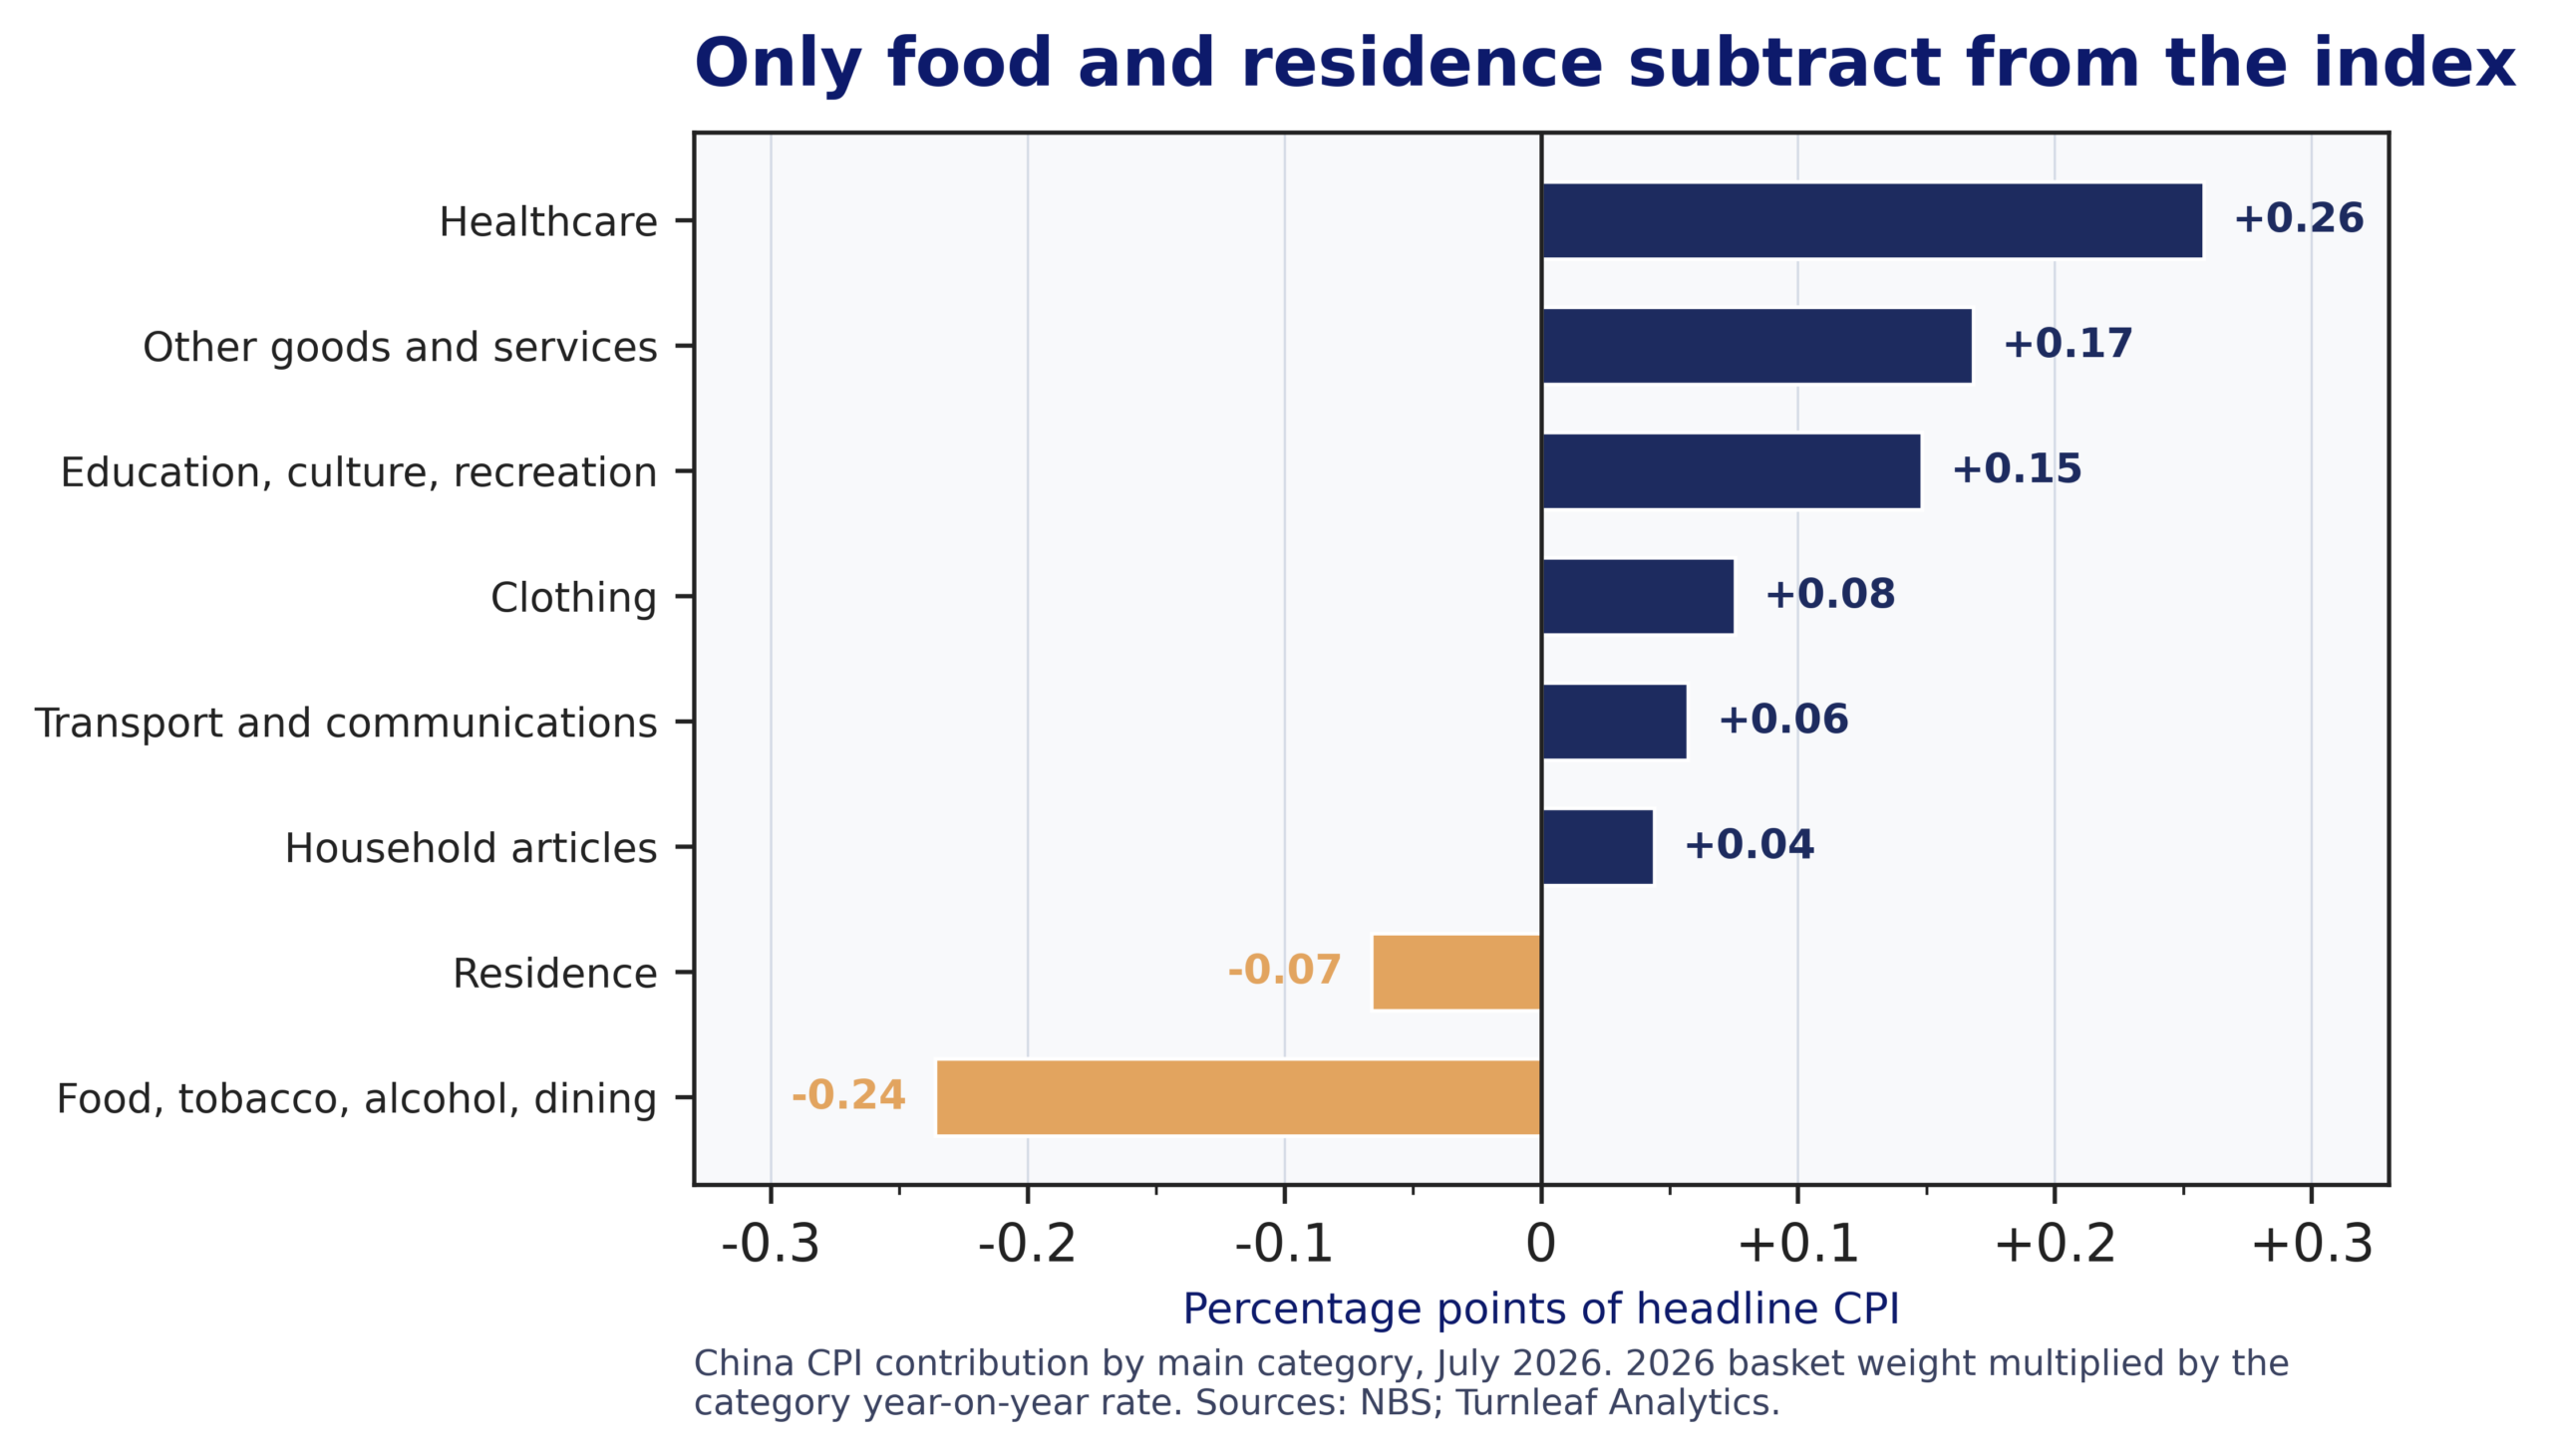
China CPI contribution by main category, July 2026, percentage points. Calculated as 2026 basket weight multiplied by the category year-on-year rate. Sources: NBS; Turnleaf Analytics.
Higher Costs Stopped Before Reaching Consumers
That underlying rate of roughly 0.4% has held through the largest imported cost shock China has faced since 2022. The Strait of Hormuz disruption pushed producer input costs sharply higher, yet the increase stopped well before the consumer basket. Producer prices for producer goods rose 4.8% YoY in July while producer prices for consumer goods fell 0.8%, leaving a 5.6 percentage point gap between the two series. Consumer-goods PPI has remained negative in every month of 2026, and the spread between the purchasing price index for industrial producers and factory-gate PPI widened from zero in January to 2.0 percentage points by July (Figure 3). The shock therefore remained concentrated in the production chain, with consumer prices largely insulated from the increase.
Figure 3
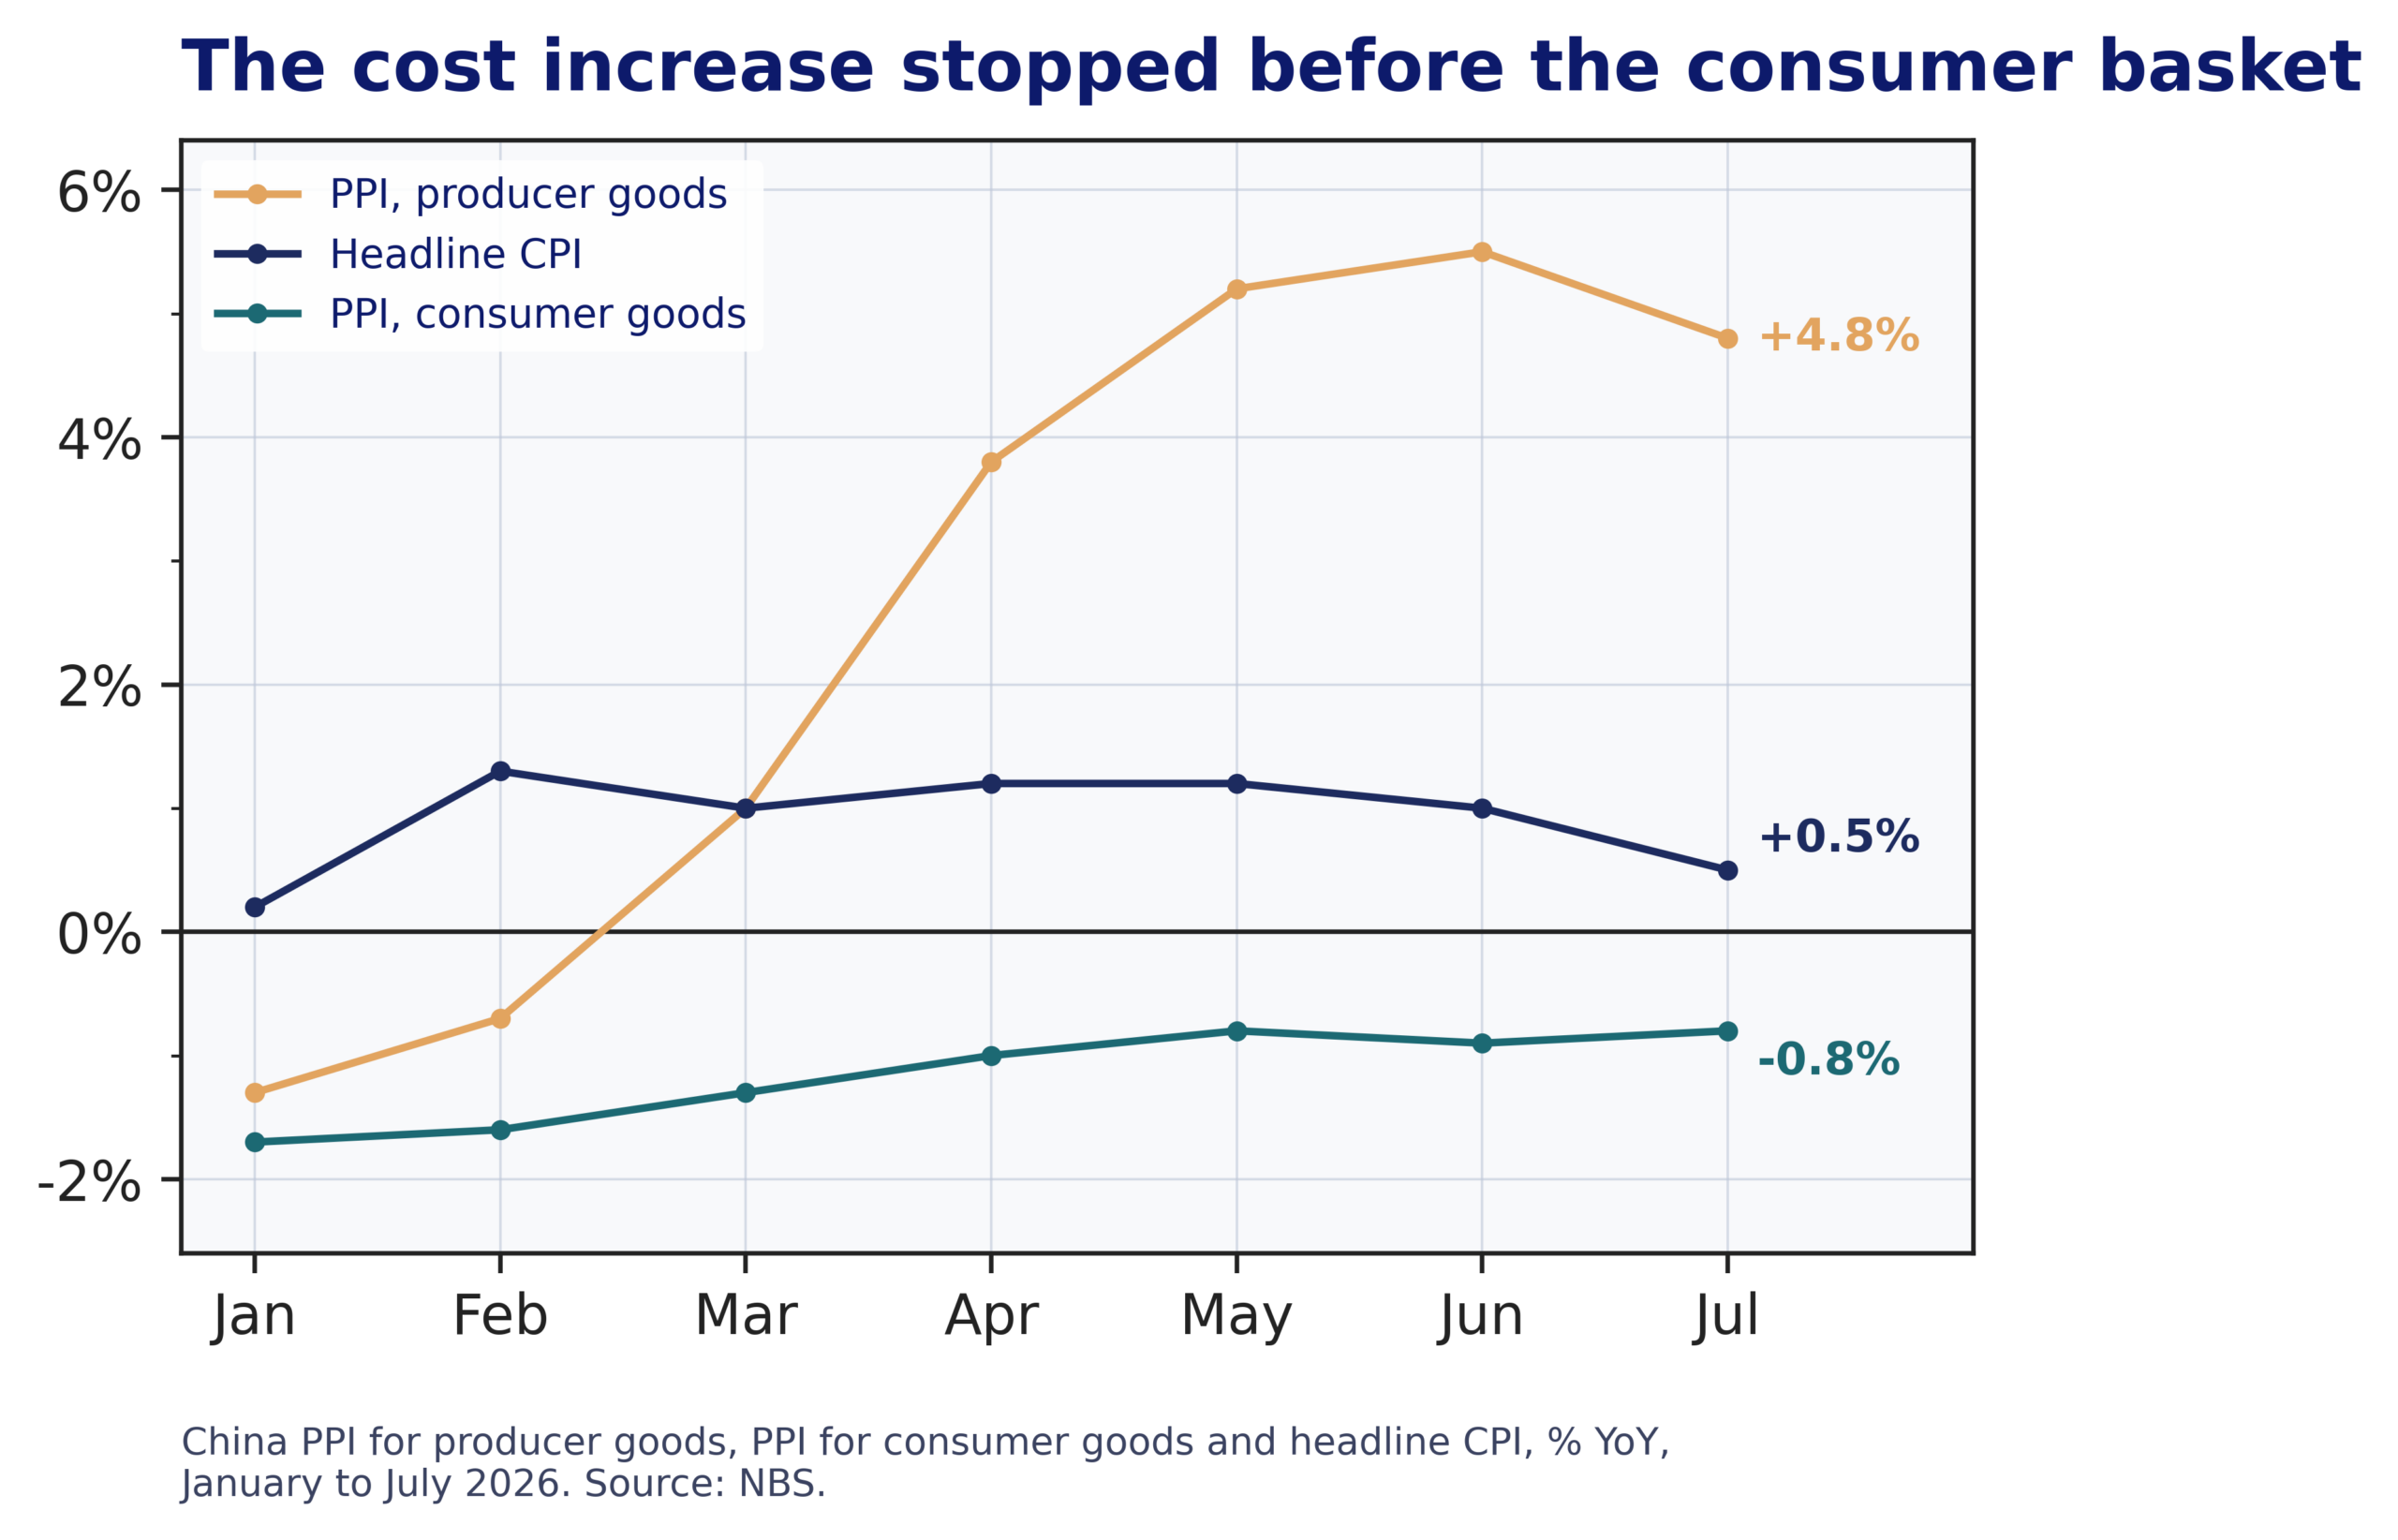
China PPI for producer goods, PPI for consumer goods and headline CPI, % YoY, January to July 2026. Source: NBS.
Industrial profit data show where the pressure settled. Profits rose 17.6% over January to July with margins at 5.66%, the highest for the period since 2022, with the gains concentrated upstream. At the sector level, the latest available first-half data show profits rose 99.4% in non-ferrous smelting, 96.9% in computers and electronics, 67.8% in raw chemicals and 41.1% in coal mining, while they fell 47.8% in non-metallic minerals, 25.0% in ferrous smelting, 19.5% in motor vehicles and 12.0% in food processing. Food processing sits directly between higher upstream input costs and the consumer basket, and its profit decline points to margin compression close to final demand. Upstream sectors captured more of the price increase, while consumer-facing producers absorbed more of the pressure.
Weak household demand helps explain that break in the chain. Retail sales rose only 0.6% YoY in July, while second-quarter GDP growth of 4.3% fell below the 4.5% to 5% target range and manufacturing capacity utilisation stood at 73.9% in the first quarter. Household spending has also lagged income growth. Per capita disposable income rose 5.2% in nominal terms in the first half while consumption rose 3.7%, leaving an implied savings rate of 35.4%. High saving and spare industrial capacity have kept pricing power weak, pushing more of the imported cost increase into producer margins.
Weak demand limited broad pass-through, while Beijing separately blocked the two channels through which the Hormuz shock could have reached CPI most quickly. Fuel intervention capped the direct energy effect, and fertiliser policy contained the upstream food channel before higher global costs reached domestic prices.
Beijing Shielded Fuel and Food Prices
Fuel was the most direct channel. The National Development and Reform Commission (NDRC) capped refined-product prices on 23 March and again on 7 April, marking the first use of that power since the pricing mechanism was introduced in 2013. On 7 April, the formula would have required increases of 800 yuan per tonne for gasoline and 770 for diesel, while the NDRC allowed 420 and 400. With fuel carrying a weight of roughly 3.3% in the CPI basket, the gap withheld about 0.1 percentage points of headline inflation. The policy cap therefore absorbed part of the global energy shock before it reached retail fuel prices.
Food was insulated one stage further upstream through fertiliser. The East European urea benchmark rose from USD 472 per tonne in February to USD 857 in April after Chinese export restrictions covered between half and three quarters of its 2024 fertiliser export volumes, yet domestic urea increased only from 1,710 yuan per tonne in January to a ceiling of 1,830. The contrast is striking. The benchmark rose by roughly four fifths, while Chinese farm input costs remained broadly contained. By keeping the fertiliser shock out of domestic agriculture, the policy response prevented the increase from becoming a food-price pipeline that would have appeared in CPI several months later (Figure 4).
Figure 4
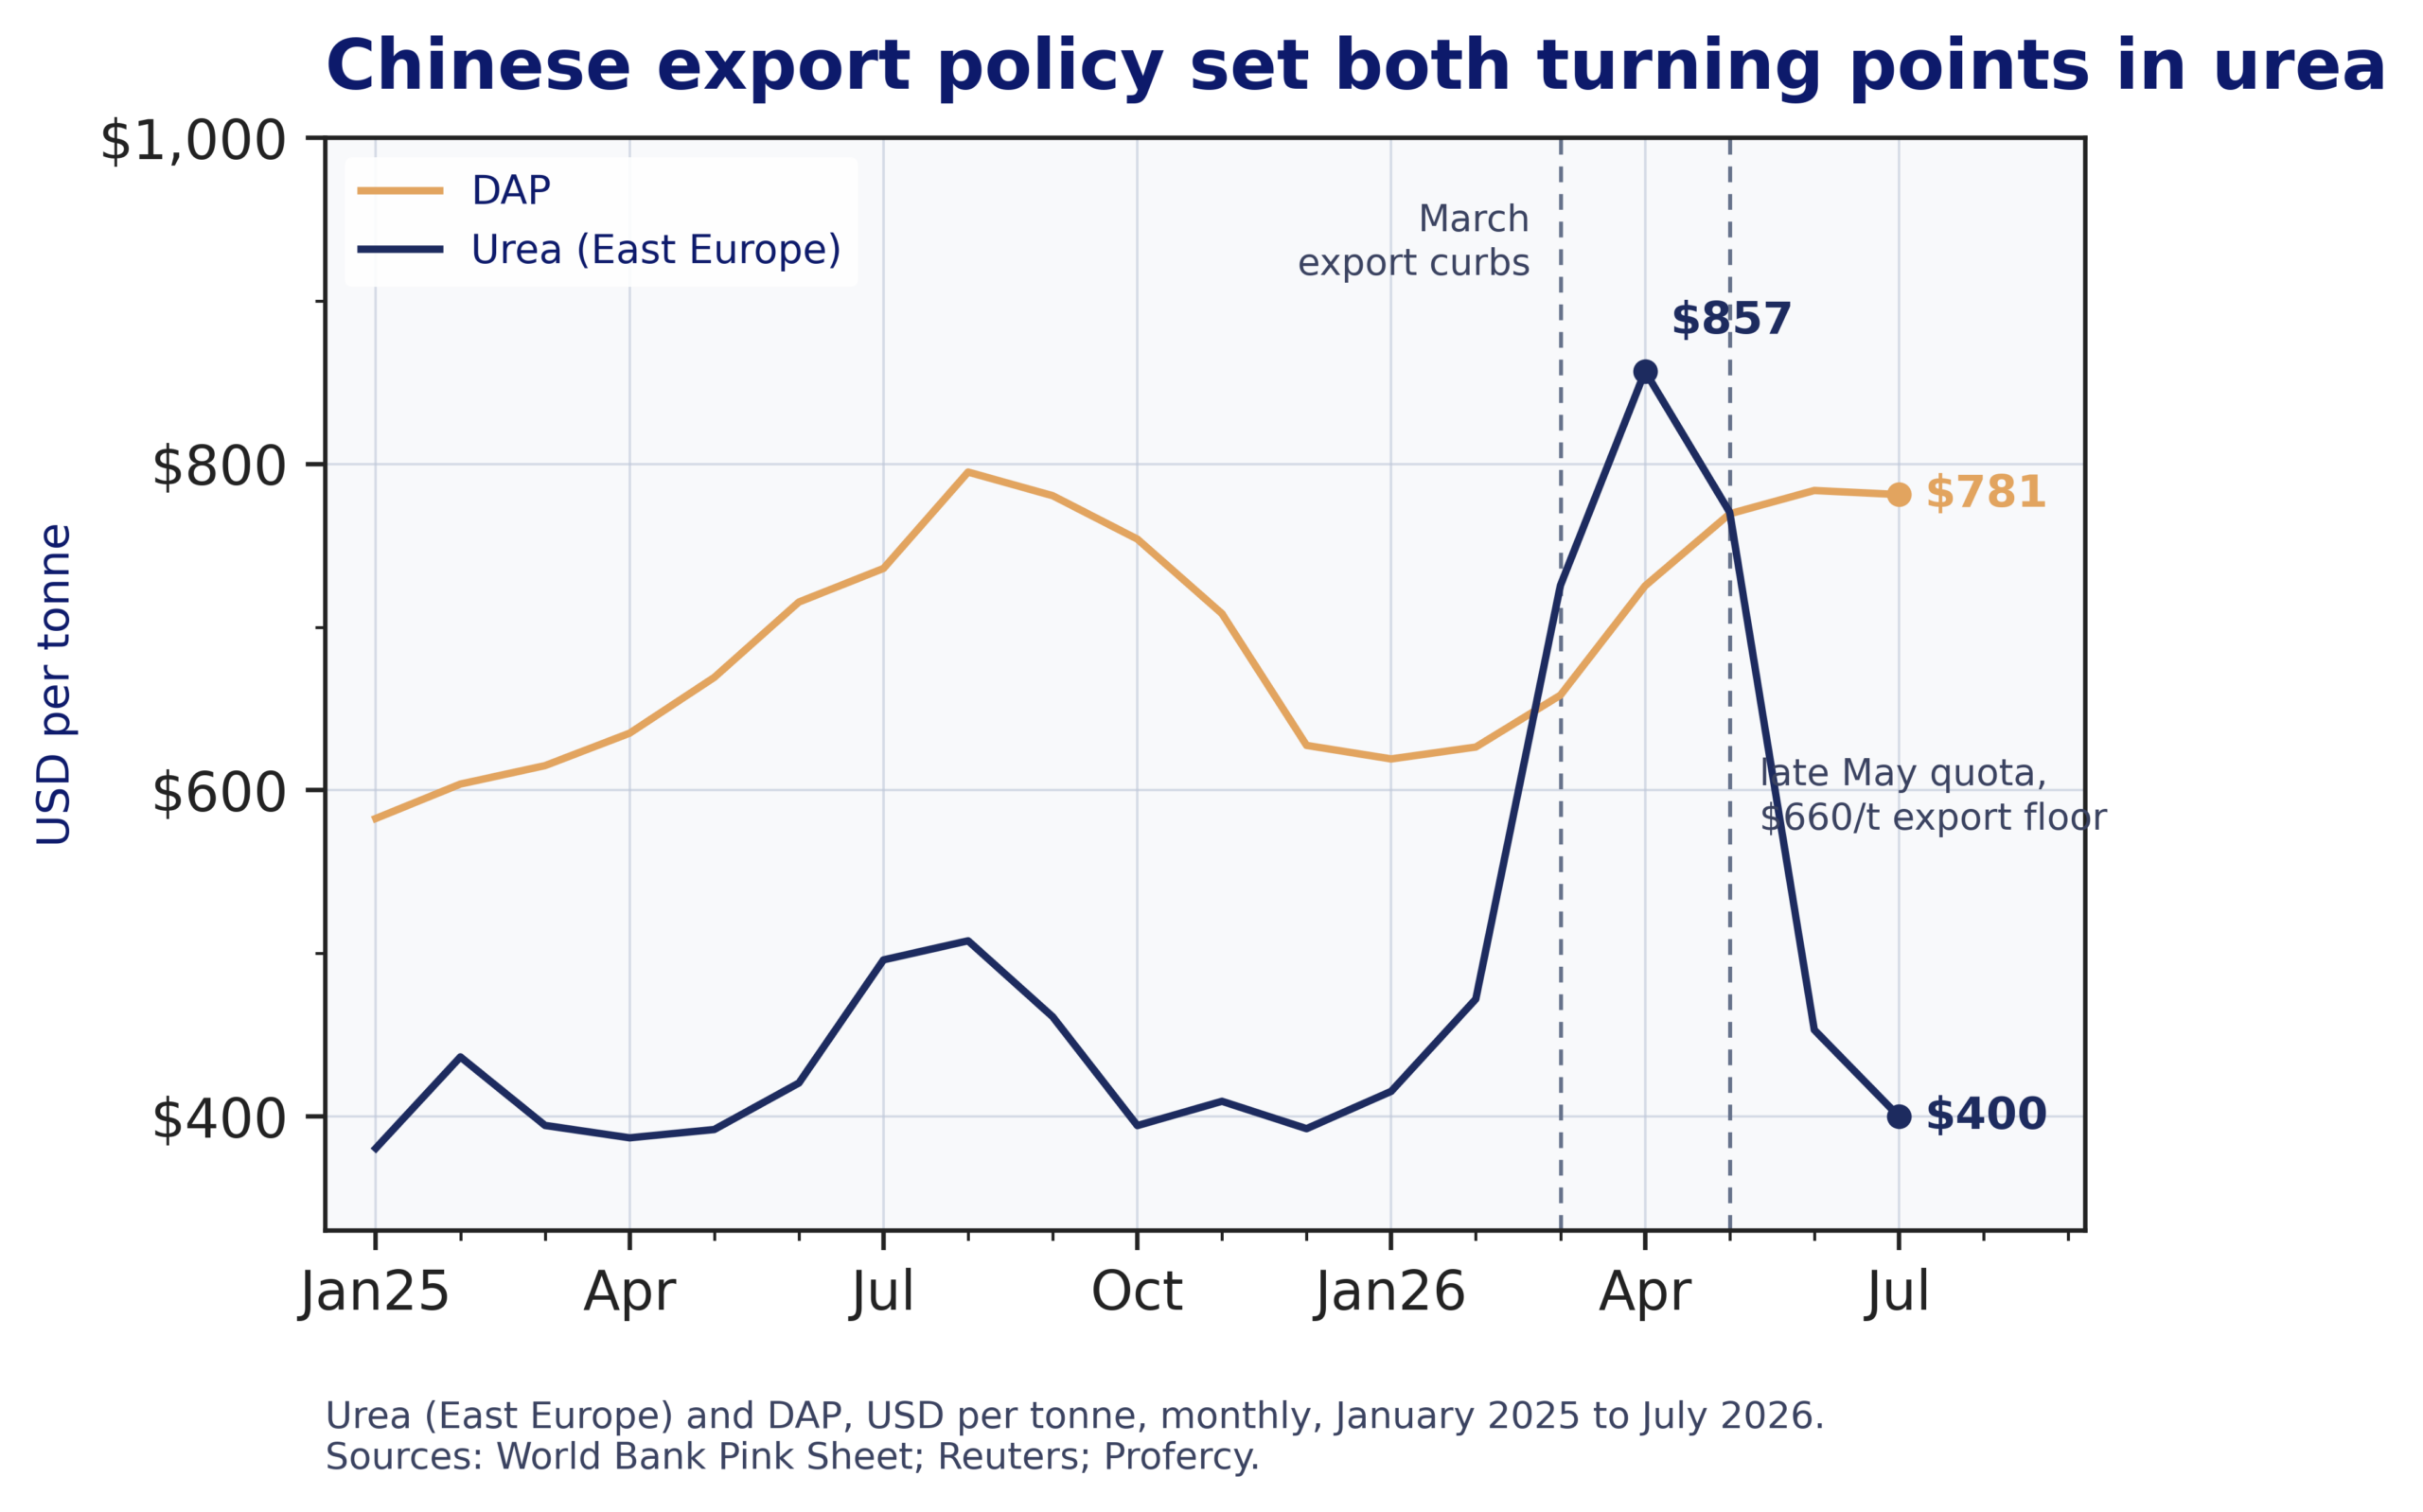
Urea (East Europe) and DAP, USD per tonne, monthly, January 2025 to July 2026, with Chinese export policy dates. Sources: World Bank Pink Sheet; Reuters; Profercy.
Those measures insulated consumers from the acute phase of the shock. With imported cost pressure now easing, the inflation outlook is increasingly being shaped by domestic forces, particularly housing weakness and the pork cycle.
Pork Prices Are Starting to Recover
Pork is large enough and cyclical enough to move the headline within our forecast horizon. It carries 1.9% of the 2026 basket and fell 13.3% YoY in July, subtracting 0.25 percentage points from headline CPI. NBS estimates the drag from food prices, down 1.5% YoY, at the same 0.25 percentage points, concentrating the largest negative food contribution in a single product cycle. A normalisation in pork prices can therefore lift CPI while broader demand remains weak.
The cycle has started to turn, although the recovery should remain gradual. Hog prices bottomed near 9.59 yuan per kilogramme in mid-May and recovered to 11.13 by late August, and in May the Ministry of Agriculture and Rural Affairs cut the national breeding sow target from 39 million head to 37.5 million. The reduction should tighten supply over time, while two offsets moderate the inflationary effect. Sow productivity rose 8.2% in 2025, so a 6.5% reduction in the herd removes less pork supply than the headline number suggests, while resumed state grain auctions and a record 150.7 million tonne summer crop are lowering feed costs. Together, those supply and cost dynamics point to a recovery in pork prices that remains contained enough to limit broader food inflation.
Turnleaf’s View
The interaction between pork and energy explains the shape of our forecast. As the drag from pork narrows toward neutral, headline inflation rises through late 2026 and reaches a peak of around 1.0% in October. From the first quarter of 2027, however, the fuel increases recorded between March and June 2026 begin to enter the year-earlier comparison, turning the energy contribution negative for two to three quarters. This base effect pulls headline inflation down to roughly 0.3% in March before fading through the spring, allowing the rate to recover to around 0.85% by July 2027. That recovery is driven mainly by the fading energy base effect, while underlying price pressures remain subdued.
As the autumn data arrive, we will focus on three developments that could shift different parts of this path. The first is the breeding sow herd relative to the revised 37.5 million target. A return to zero pork inflation alone would add around 0.25 percentage points to the headline, making pork the main source of upside within our forecast horizon. The second is the gap between the NDRC’s published fuel adjustments and the increases implied by its own formula, which would come back into focus if a renewed Hormuz disruption pushed some of the previously withheld increases into retail prices. The third is rented housing CPI relative to private rental indices. The 2.2 percentage point divergence in the second-largest category of the basket creates the greatest measurement uncertainty around the downside path.
The same domestic conditions that kept the largest imported cost shock in four years concentrated within the production chain continue to limit the pass-through into consumer prices.