
US airline fares rose 2.7% in August on a seasonally adjusted basis and were 23.4% higher than a year earlier before adjustment. The increase was one of the services components behind a 0.3% MoM core CPI print, above the 0.2% consensus, and strengthened the case for a Federal Reserve hike. It was also the eighth consecutive monthly increase in the seasonally adjusted airfare series, which has risen 21% since December.
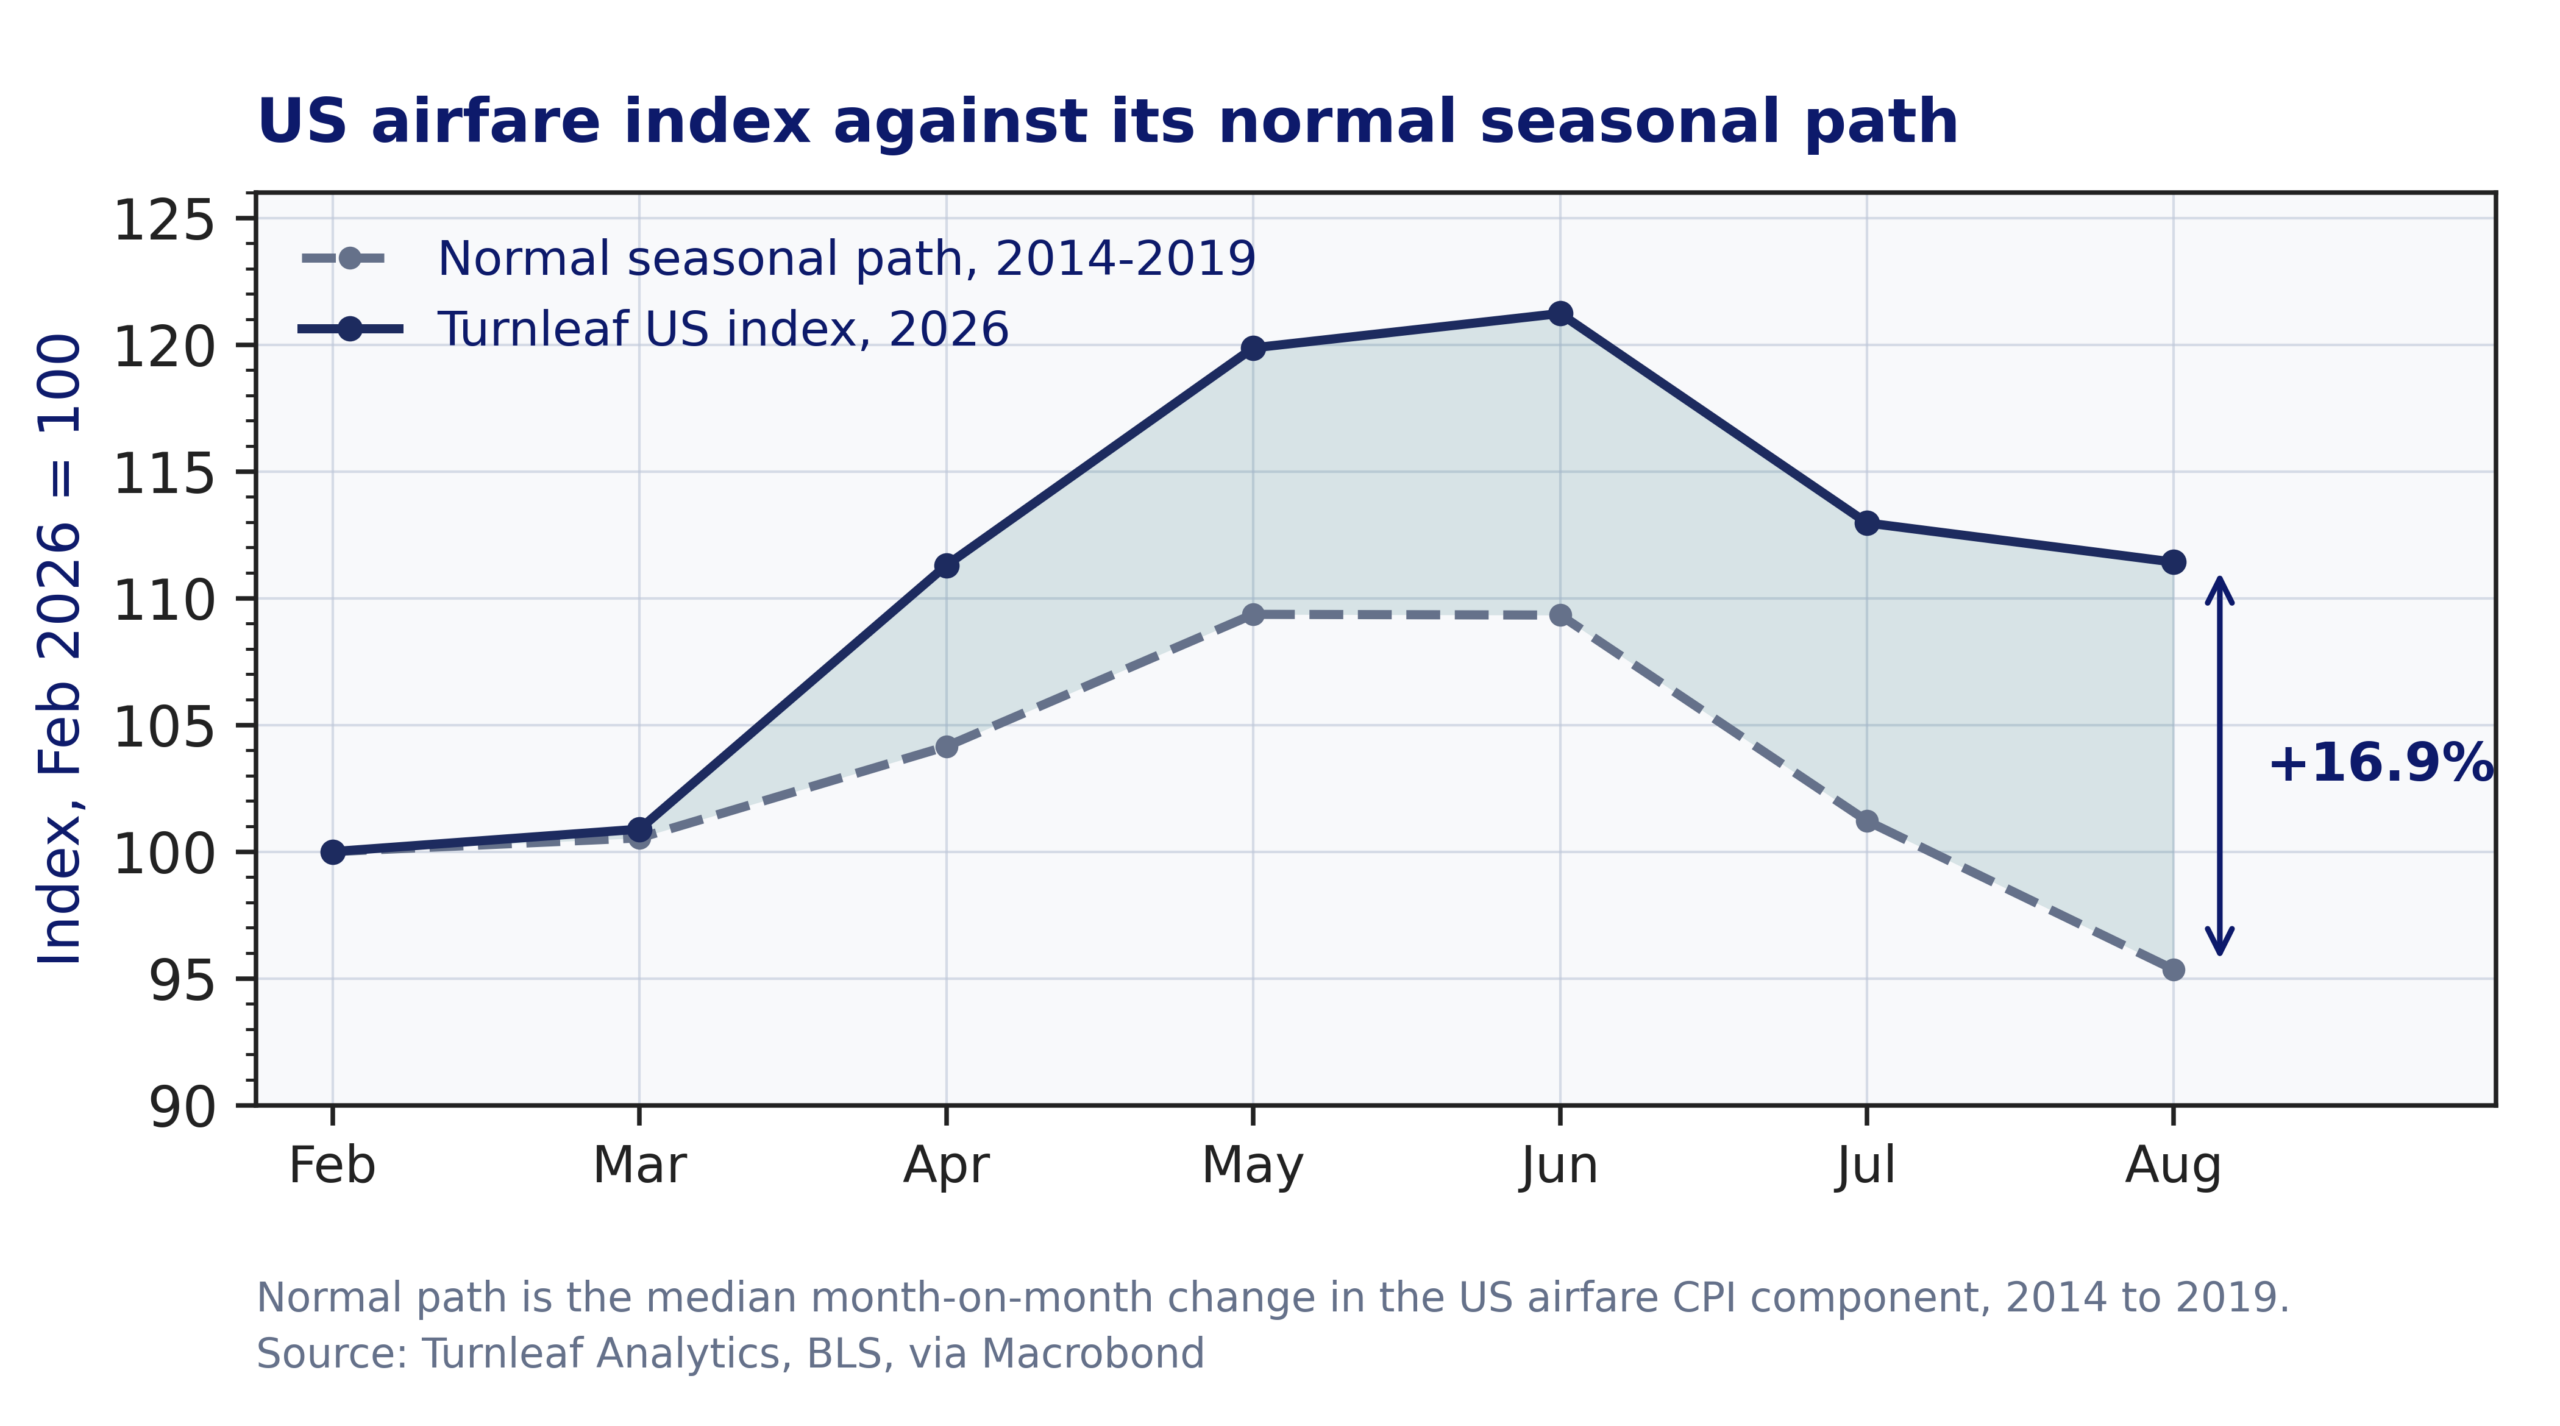
Our daily local-market airfare indices show what produced that print. Airfares have one of the strongest seasonal patterns in the CPI basket. US fares normally fall by around 13% between June and August, but our US index fell by just 4% this year. In other words, fares declined, but by less than a third of their usual summer drop. That left them further above their normal seasonal path in August than they had been in June, a widening gap that appeared in the BLS data as a 2.7% seasonally adjusted increase.
The same data show why the level of airfares alone carries so little information this year. Our US index peaked in June and has drifted lower since, so looking only at the raw level would suggest that the pressure was fading. Relative to a normal year, however, the opposite has happened. The official airfare series provide decades of history against which to estimate that normal seasonal path and compare 2026 with it. On that basis, US fares are running 16.9% above their normal February-to-August path (Figure 1).
Figure 1. Our 2026 US local-market index against the normal seasonal path of the official airfare component
Does It Generalise
We ran the same test on the rest of the panel, each market against its own season, since seasonal patterns differ sharply: a normal February to August lifts Italian airfares by 88%, for example, against 13% in Spain.
Crude is a world price, so a fuel-driven shock should have reached every market. Four of the eleven are above their own season, and the readings range from 23% above to 33% below (Figure 2). A common cost shock does not produce that spread, which puts the weight on how much of the crude move reached each domestic fuel bill.
Figure 2. Our local-market indices measured against each market’s own normal seasonal path.
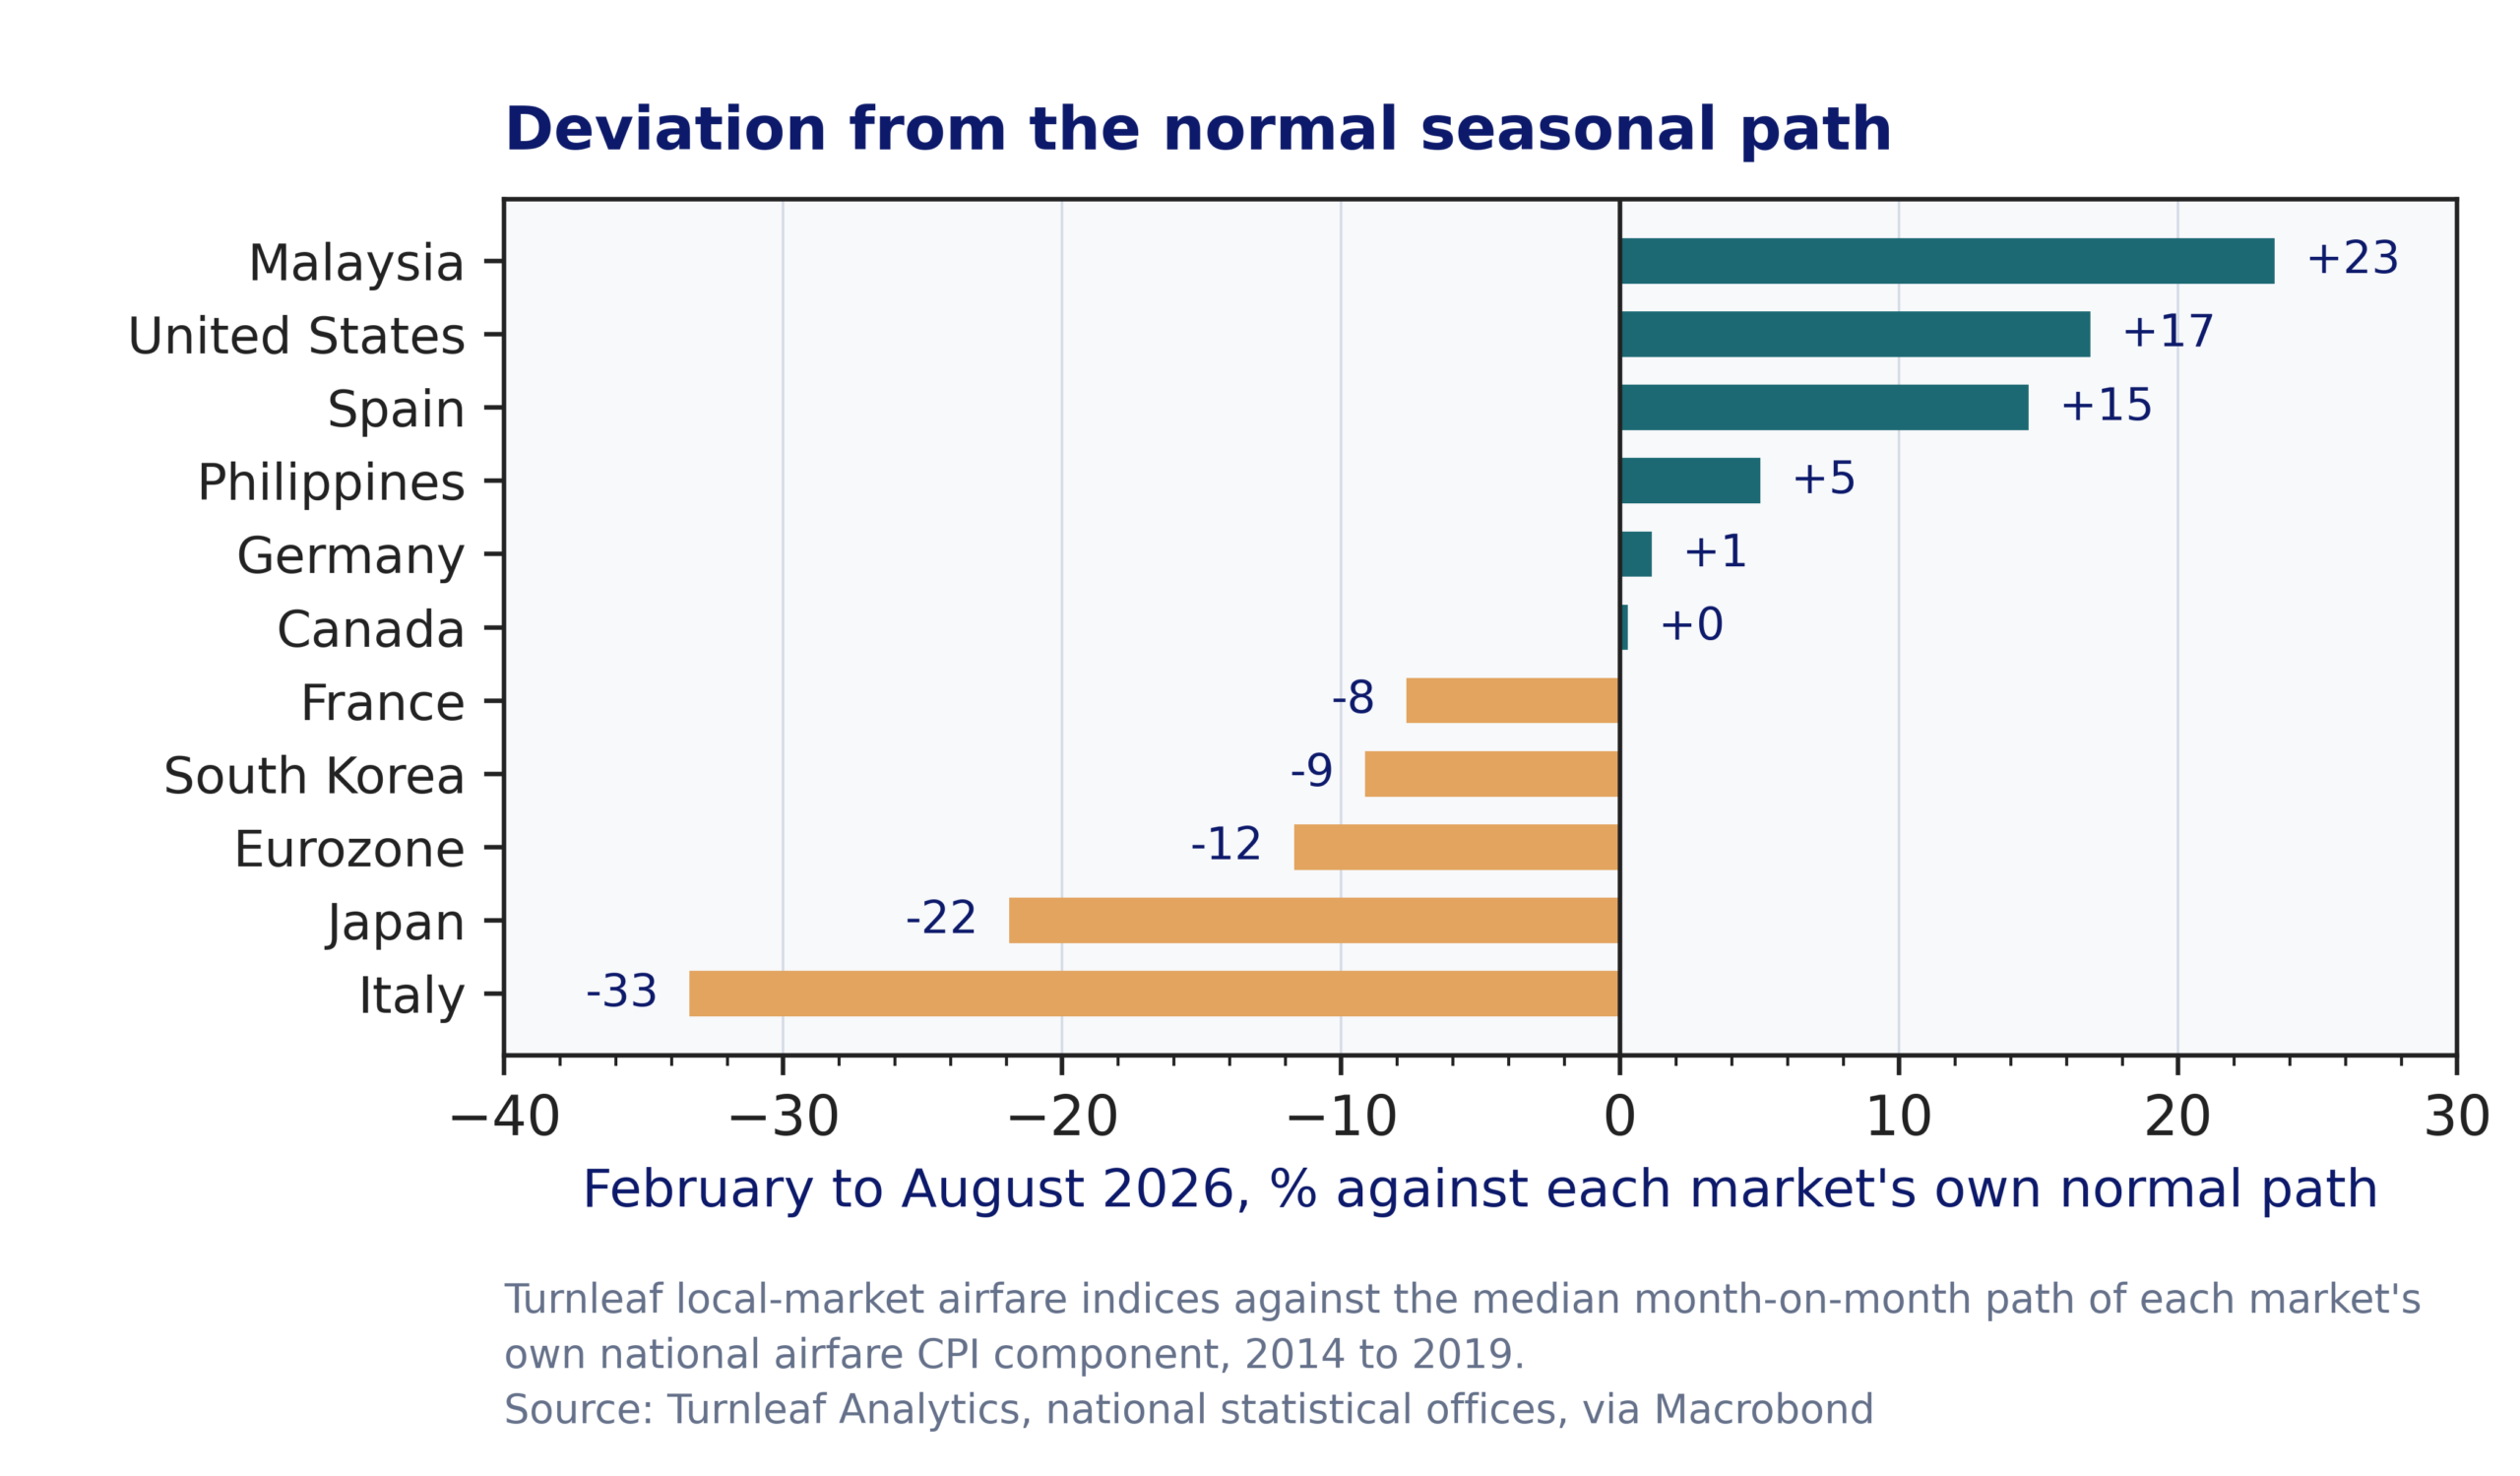
Our retail fuel indices explain much of that split, and fuel policy explains the rest. Japanese pump prices rose 10% between February and August and have been flat since April, because the government holds them near ¥170 a litre, and it subsidises aviation fuel on domestic routes directly, doubling that support to ¥20.9 a litre from 3 September. As a result, the cost shock never reached Japanese carriers. Malaysian pump prices, similarly, rose 8% against the RON95 ceiling, which leaves capacity and demand as the source of the 23% overshoot there. US pump prices, by contrast, stood 52% above February by May, the largest increase in the panel, in the market whose fares moved furthest from their season.
Europe, however, is the exception, because its fuel costs did rise, only late. The euro-area fuel index gained 10.7% in August alone, after drifting lower through the early summer, so most of the increase arrived once summer fares had already been sold. The European pass-through therefore still sits ahead of the prints.
We ran the same measurement on the official CPI components as a check. That puts the United States 15.8% above season against our 16.9%, and the two agree in direction in Malaysia, Italy, Japan and the euro area. They disagree in Canada, the Philippines and South Korea, where the official series sits well above season and ours does not, and in Spain, where ours is well above and the official reading is only 3% above. Those gaps are too wide to come from our head start on the statistical office, and point to differences in route and cabin coverage. We treat the markets where both measures agree as settled, and read the divergent ones for direction alone.
The Turnleaf View
To read the rest, visit our latest Substack post, here.