
US headline CPI printed 3.4% YoY in July 2026 with core at 2.5%, a second consecutive deceleration from the 4.2% peak in May. This morning’s PCE release for the same month ran hotter, with headline at 3.7% and core at 3.3%, and the second estimate of Q2 revised the PCE price index up to 5.3% annualised. Turnleaf’s 25 August 2026 daily forecast holds close to 3.4% through October, rises to a peak near 3.8% in January 2027, falls to a trough around 2.4% in May 2027, and returns to 3.1% by July 2027, recovering 0.7 percentage points of that fall in two months (Figure 1). Successive daily vintages since 19 August have shifted down by five to eight basis points across the horizon, with the January peak moving from 3.87% to 3.81%, so the Section 338 duties that took effect on 22 August changed our path by less than a tenth of a percentage point.
The Freight Leg Is Still Ahead of the Prints
The closure of the Strait of Hormuz in late February pushed up both crude prices and the cost of shipping goods to the United States. Crude prices have since retraced, but freight costs remain elevated.
Brent settled at USD 87.12 per barrel on 25 August, down 5.5% on the day as the war premium unwound, and roughly 30% above a year earlier. Retail gasoline was USD 4.085 per gallon in the week to 24 August against USD 4.305 at the June peak. Gasoline carries 3.9% of the CPI basket and ran 24.6% YoY in July, which adds roughly 0.9 percentage points to the 3.4% headline on its own. Prices at the current level have stopped rising, so that contribution unwinds once the February to June 2026 spike clears the twelve-month base, and it accounts for the 1.4 percentage point fall between our January peak and the May trough.
Freight has moved the other way. Far East to US West Coast spot container rates are up 283% since 28 February, with the Xeneta index at 7,246 on 25 August, and the Harpex charter index at 2,380 on 21 August. Both series enter our forecast directly. What reaches CPI is the contract book, since most US importers ship on annual contracts agreed in advance, and contract rates on the same lanes have risen 39% to 42% since February (Figure 2). Those contracts fix a higher freight cost into the landed price of goods arriving through 2027. A fall in spot rates from here leaves that committed cost in place, so freight keeps adding to goods prices while the crude leg subtracts from the headline.
Figure 2
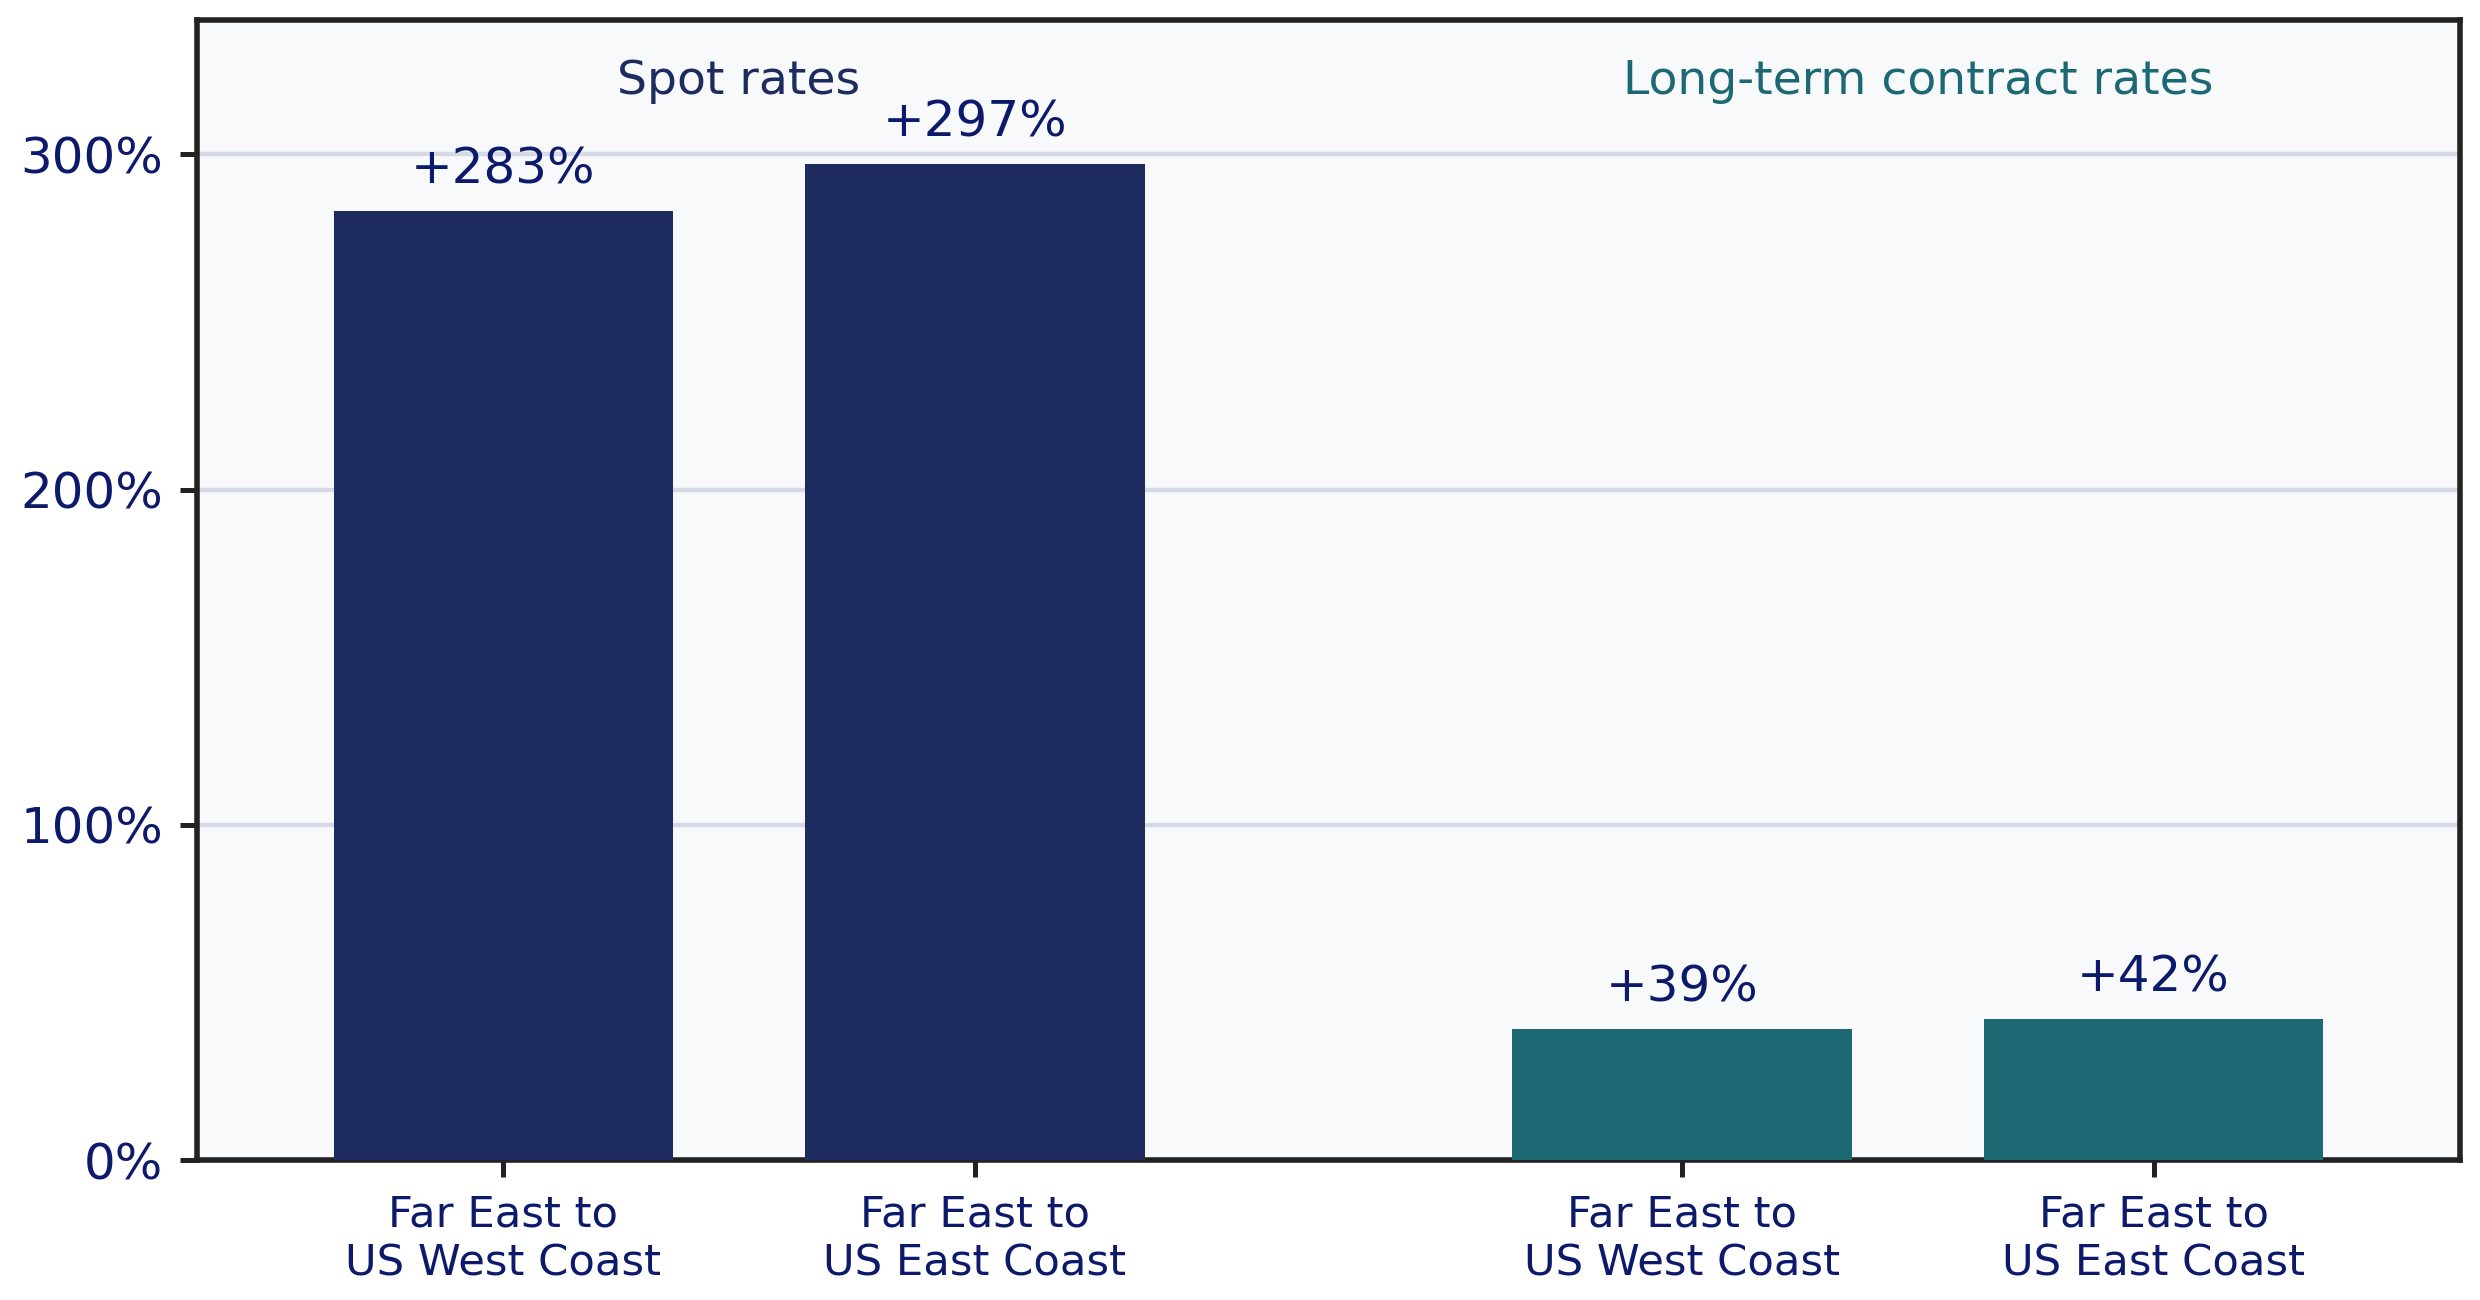
Change in Far East to US container rates, 28 February to 21 August 2026, spot against long-term contract. Source: Xeneta.
Two further readings show that this cost has not yet reached consumers. The Global Supply Chain Pressure Index reached 1.82 in April, a four-year high, and has eased to 0.79 in July, which leaves delivery times and input prices above their historical norms. Business inventories are thin, with the inventory to sales ratio at 1.30 in June against 1.39 a year earlier as nominal sales grew 10% YoY against 3% for inventories. Retailers therefore hold less pre-shock stock to sell through, so goods bought at post-February freight rates reach the shelf earlier in this cycle than in a normal one.
The Dallas Fed modelled a 5% rise in trade costs from the closure, which it treats as a lower bound, and finds it adds roughly 0.1 percentage points to core PCE inflation, with the maximum effect in the fourth quarter of 2026 because the cost accumulates through production chains before reaching the shelf. That timing places the peak of the freight contribution inside the November to January window where our curve rises to 3.81%, and it keeps adding to core goods prices through the first half of 2027 while the energy base effect pulls the headline down.
The Tariff Schedule Adds Less Than the Freight
The tariff regime has moved the other way this year. The Supreme Court struck down the International Emergency Economic Powers Act (IEEPA) tariffs on 20 February, the 10% Section 122 surcharge lapsed on 24 July, and the St Louis Fed puts the effective tariff rate near 7% in May 2026 against an 11% peak in late 2025. A 50% Section 338 duty took effect on 22 August, delayed three days by Proclamation 11056. The measures are named for the Canadian orders they answer, and the goods they cover run wider than those names suggest, with 439 tariff lines reaching food, textiles, wood, furniture and machinery, while vehicles themselves are carved out because they already sit under Section 232. United States-Mexico-Canada Agreement (USMCA) origin gives no exemption. RBC puts the effective rate on Canadian goods at around 6% after the change against around 3% before, on roughly 5% of Canadian exports to the US, and Canada retaliates on roughly USD 20 billion of US goods from 8 September. Our daily vintages moved by five to eight basis points across the announcement, so the tariff adds less to the January peak than the freight contribution above.
Tariffs remain useful for showing where pass-through is fastest. A duty on a good the US can make more of is shared between exporters, margins and consumers. A duty on a good it cannot make more of goes to the shelf price in full. The US herd is the smallest since 1951 at 86.2 million head and US ground beef cannot be blended without imported lean trim, which on Derrell Peel’s estimate at Oklahoma State supplied 38.7% of US ground beef trim in 2025 against a twenty-year average near 25%. The schedule has been amended four times in ten months on that basis, and beef inflation fell from 16.4% in December 2025 to 9.4% in July across those steps, moving through within roughly two prints of each amendment (Figure 3).
Figure 3
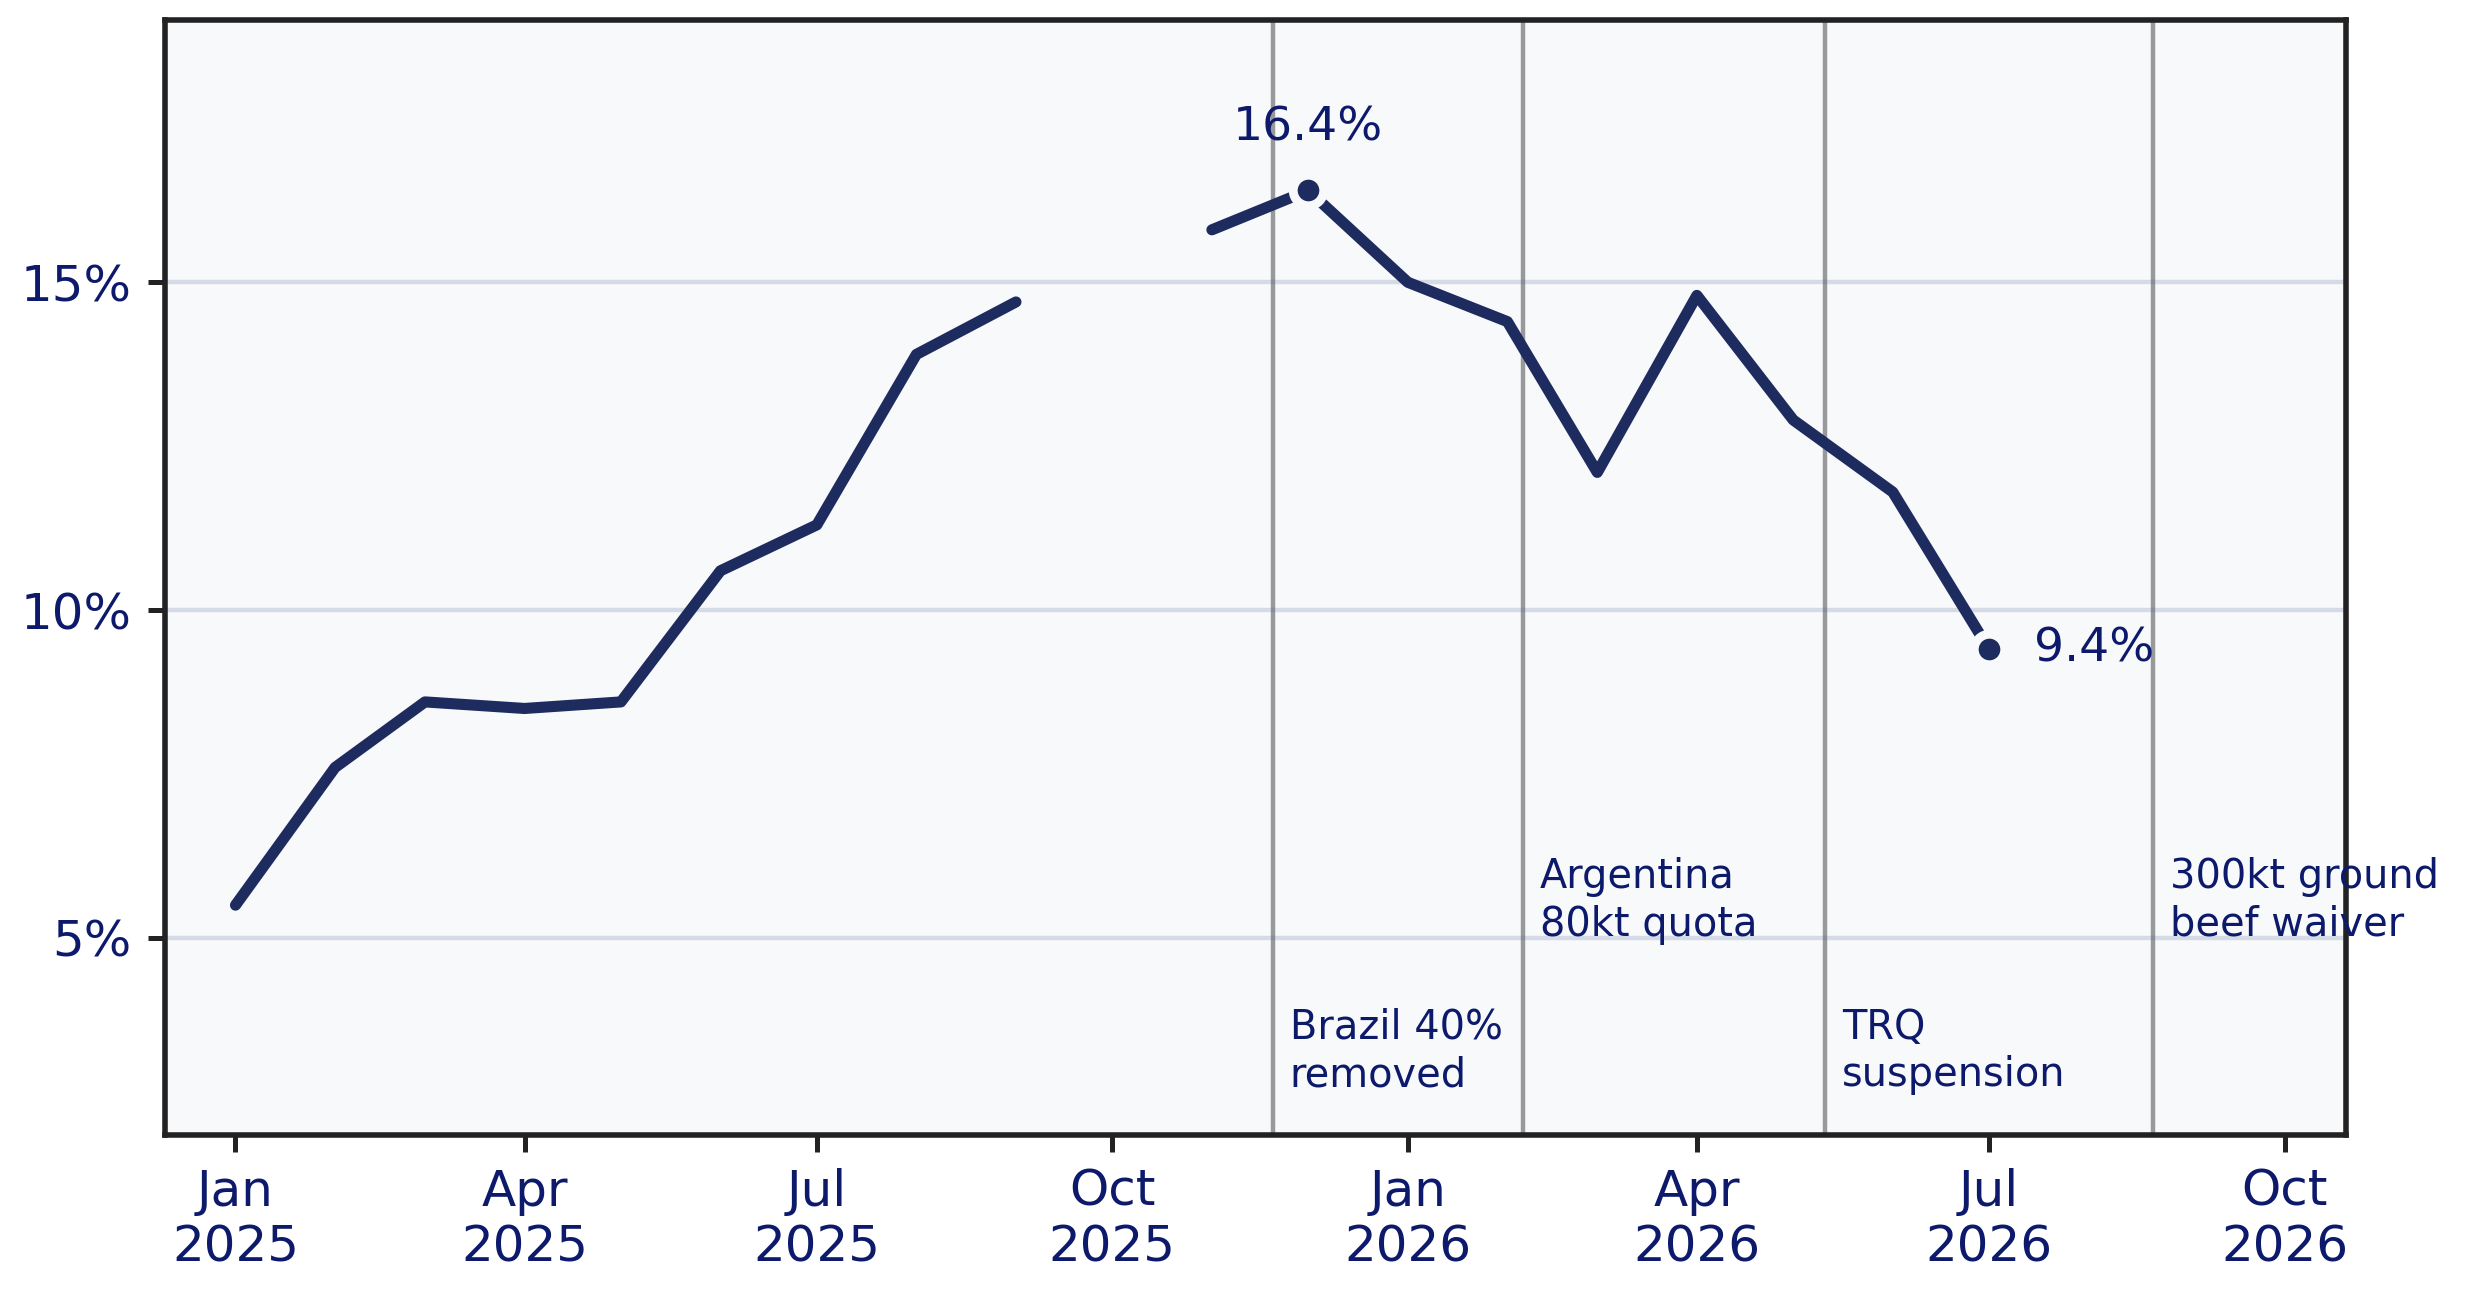
US CPI beef and veal, % YoY NSA, with the four tariff amendments marked. There is no October 2025 observation, as BLS did not collect that month. Sources: BLS; USDA; Turnleaf Analytics.
The fourth of those amendments, a 90 day waiver on 300,000 tonnes of ground beef announced on 21 August, carries no implementing proclamation as of today, so we hold it outside the forecast. Imported consumer goods meet the same condition as beef for the length of a freight contract. US producers cannot expand output quickly enough to undercut a higher landed cost, so the freight increase reaches shelf prices in apparel, household furnishings and consumer electronics, which source predominantly from Asia.
No Offset From the Labour Market
To read the rest of this article and gain access to Turnleaf’s latest US CPI forecast, visit our latest Substack post, here.