US CPI YoY NSA came in at 2.7%, significantly below consensus expectations (3.1%) and our own model forecast (3.0%). Core CPI YoY NSA also printed weaker at 2.6% versus market expectations. The 40 basis point miss represents one of the largest negative surprises in recent years.
The government shutdown created a structural data gap in October 2025 CPI collection, forcing BLS to employ imputation methods for survey-dependent components. The two-month aggregate reporting structure creates measurement uncertainty when monthly observations are missing.
To understand the number, we need to understand the 2-month changes from Sep to Nov 2025, as well as changes in the YoY figures between Sep to Nov 2025, whilst also factoring in base effects.
What components moved most to the downside?
We plotted the lower-level components which had gone down the most by looking at the change in YoY between Sep-Nov 2025 adjusted for their contribution to the final CPI YoY NSA number (ie. adjusted by their weights, rather than the outright numbers).
Figure – Components with largest downside differences between Sep-Nov YoY NSA
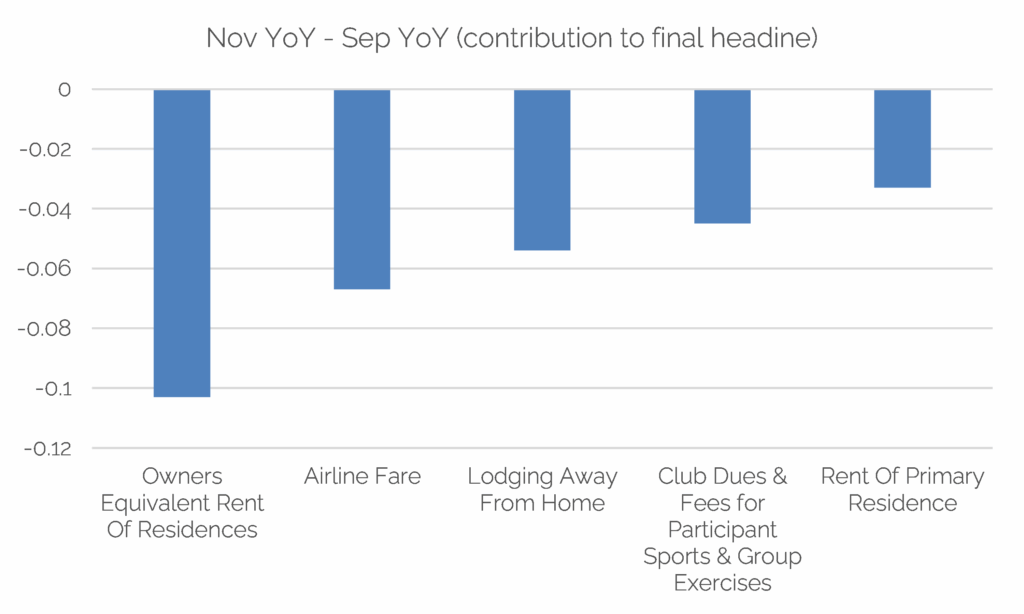
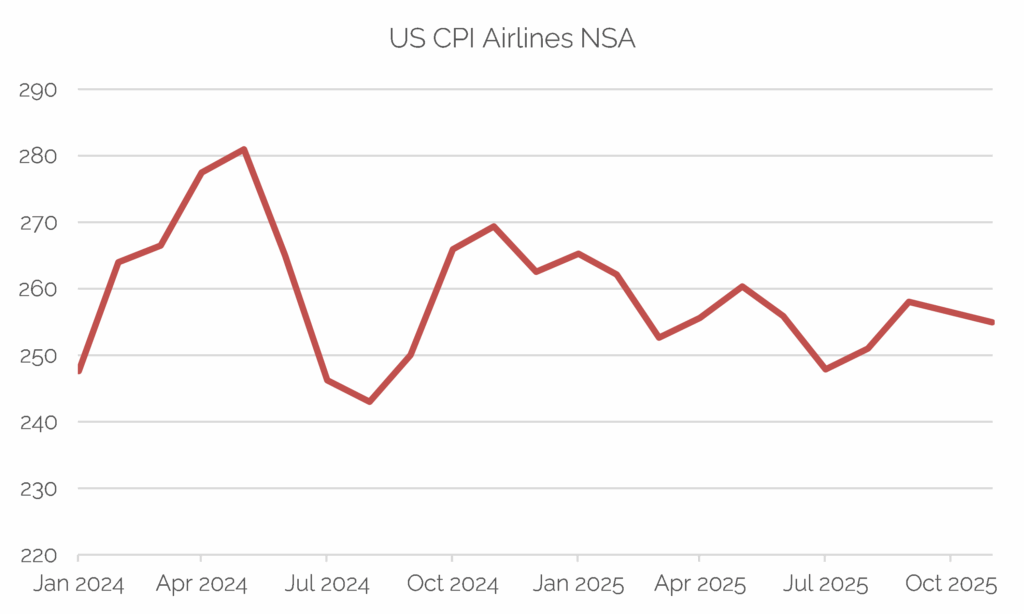
All these five components are part of US Core Services, and we’ll look at each in turn. Our US hotel data tracks the official US CPI hotel/lodging away from home NSA index, and the 9.9% move lower between Sep-Nov tracks our estimates of 8.6% lower over the same period (where these figures are unweighted). For the official US CPI airline NSA, the change from Sep to Nov also fits with our own estimates. There are also base effects driving the downward move Nov 2024-Nov 2025 vs. Sep 2024-Sep 2025, given the large jump in the index in Oct 2025.
Figure – US CPI Airlines NSA
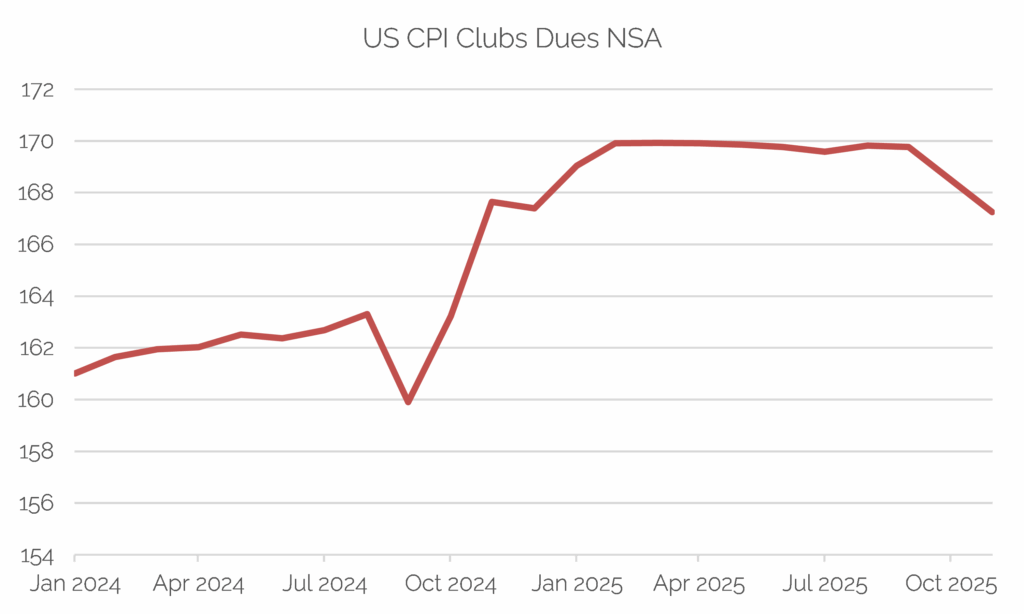
There was a move lower in 2-month change between Sep-Nov US CPI Club Membership for Shopping Clubs. Another factor driving the large decline on a YoY basis between Sep-Nov was that the large rise in Nov 2024 fell out of the base for Nov 2025’s YoY NSA figure (vs. Sep 2025 YoY NSA).
Figure – US CPI Membership for Shopping Clubs Other Organizations NSA
Hence, we can explain the changes in YoY between Sep and Nov either because of base effects or they crosscheck with other data we collect. This leaves the OER and Rent of Primary Residence components.
The biggest component to have the largest downside change in YoY between Sep and Nov 2025 was CPI OER NSA (-0.10%). Bloomberg: Some Perspective on Shelter Inflation Data 18 Dec 2025 observed some unusual patterns in the CPI Shelter components, by comparing the 2-month change between Sep and Nov versus historical MoM data. We can do similar analysis on the OER NSA component. If we look at the 2-month change between Sep and Nov, it is 0.2%, which is close to the average 1 month change over the past 12 months (Sep 2024-Sep 2025) of 0.32%.
If we repeat the exercise for CPI Rent of Primary residence NSA (-0.033%), we see something similar, with the 2-month change of 0.24% being close to the average 1 month change (0.29%). Both components hence look relatively low to history, and roughly half what you might expect looking at recent averages, suggesting that the missing month of data was set at zero.
If we were to double the 2-month change (ie. Sep to Nov 2025) for CPI OER NSA, the YoY change would be 10bp higher, and the CPI Rent of Primary residence NSA would be 2bp higher. Hence, CPI YoY NSA (reported at 2.735% for Nov 2025) would have been 12bp higher, ie. 2.851%, rounding to 2.9%.
Market Reaction
The relatively small reaction in the market following the print, despite the large surprise, suggested that market participants were largely discounting the print.
Figure – Relatively small reaction in USDJPY (-20 pips) after the Nov US CPI print was released

Turnleaf’s Alternative Data Approach
To address measurement uncertainties in official CPI releases, Turnleaf augments its inflation forecasting with real-time alternative data sources across the most vulnerable components. For shelter (33% of CPI), we track Zillow’s Observed Rent Index for All Homes & Multi-Family and the New York City Rental Price Index to capture asking rent trends in real-time, providing shelter inflation nowcasts with 2-week lead time versus BLS survey collection. For food away from home (6%), we utilize CPI Basket Rolling Food Tone Volume Weighted sentiment indicators derived from alternative text analysis to detect menu price momentum ahead of official releases. Travel costs are captured through our proprietary Hotels ADR Price Index and Average Hotel Prices data, which provide real-time lodging cost trends across major metropolitan areas independent of BLS collection. Used vehicles (2.5%) are tracked through wholesale auction indices that feed into the New and Used Motor Vehicles Index.
This multi-source approach allows us to construct an independent inflation estimate when official data collection is disrupted and provides clients with higher-frequency, higher-confidence inflation signals that don’t rely solely on government statistical infrastructure. When discrepancies emerge, as in November 2025, we can quantify the gap between official readings and alternative data, giving clients early warning of potential measurement artifacts before they’re revealed in subsequent releases.
Overall, the gap between these reported changes and historical trend patterns suggests underlying inflation may be stronger than the headline 2.7% figure indicates making December’s CPI release decisive. If inflation moves back toward 3.0%, evidence of measurement error will be confirmed, but if it remains low, disinflation may be underway.