Today, the United States and Iran have signed a deal ending the war. Among the many points outlined in the agreement, the normalization of trade through the Strait of Hormuz, scheduled for tomorrow, is the most consequential for oil markets. Front-month futures fell sharply after the announcement with the International Energy Agency warning that the market could swing back into surplus once supply through the strait resumes and the more than one hundred oil-laden tankers currently stranded in the Gulf are released (Figure 1).
Figure 1
WTI futures term structure before and after the Trump-Iran memorandum of understanding (NYMEX WTI via Oilprice.com, Barchart and Investing.com).
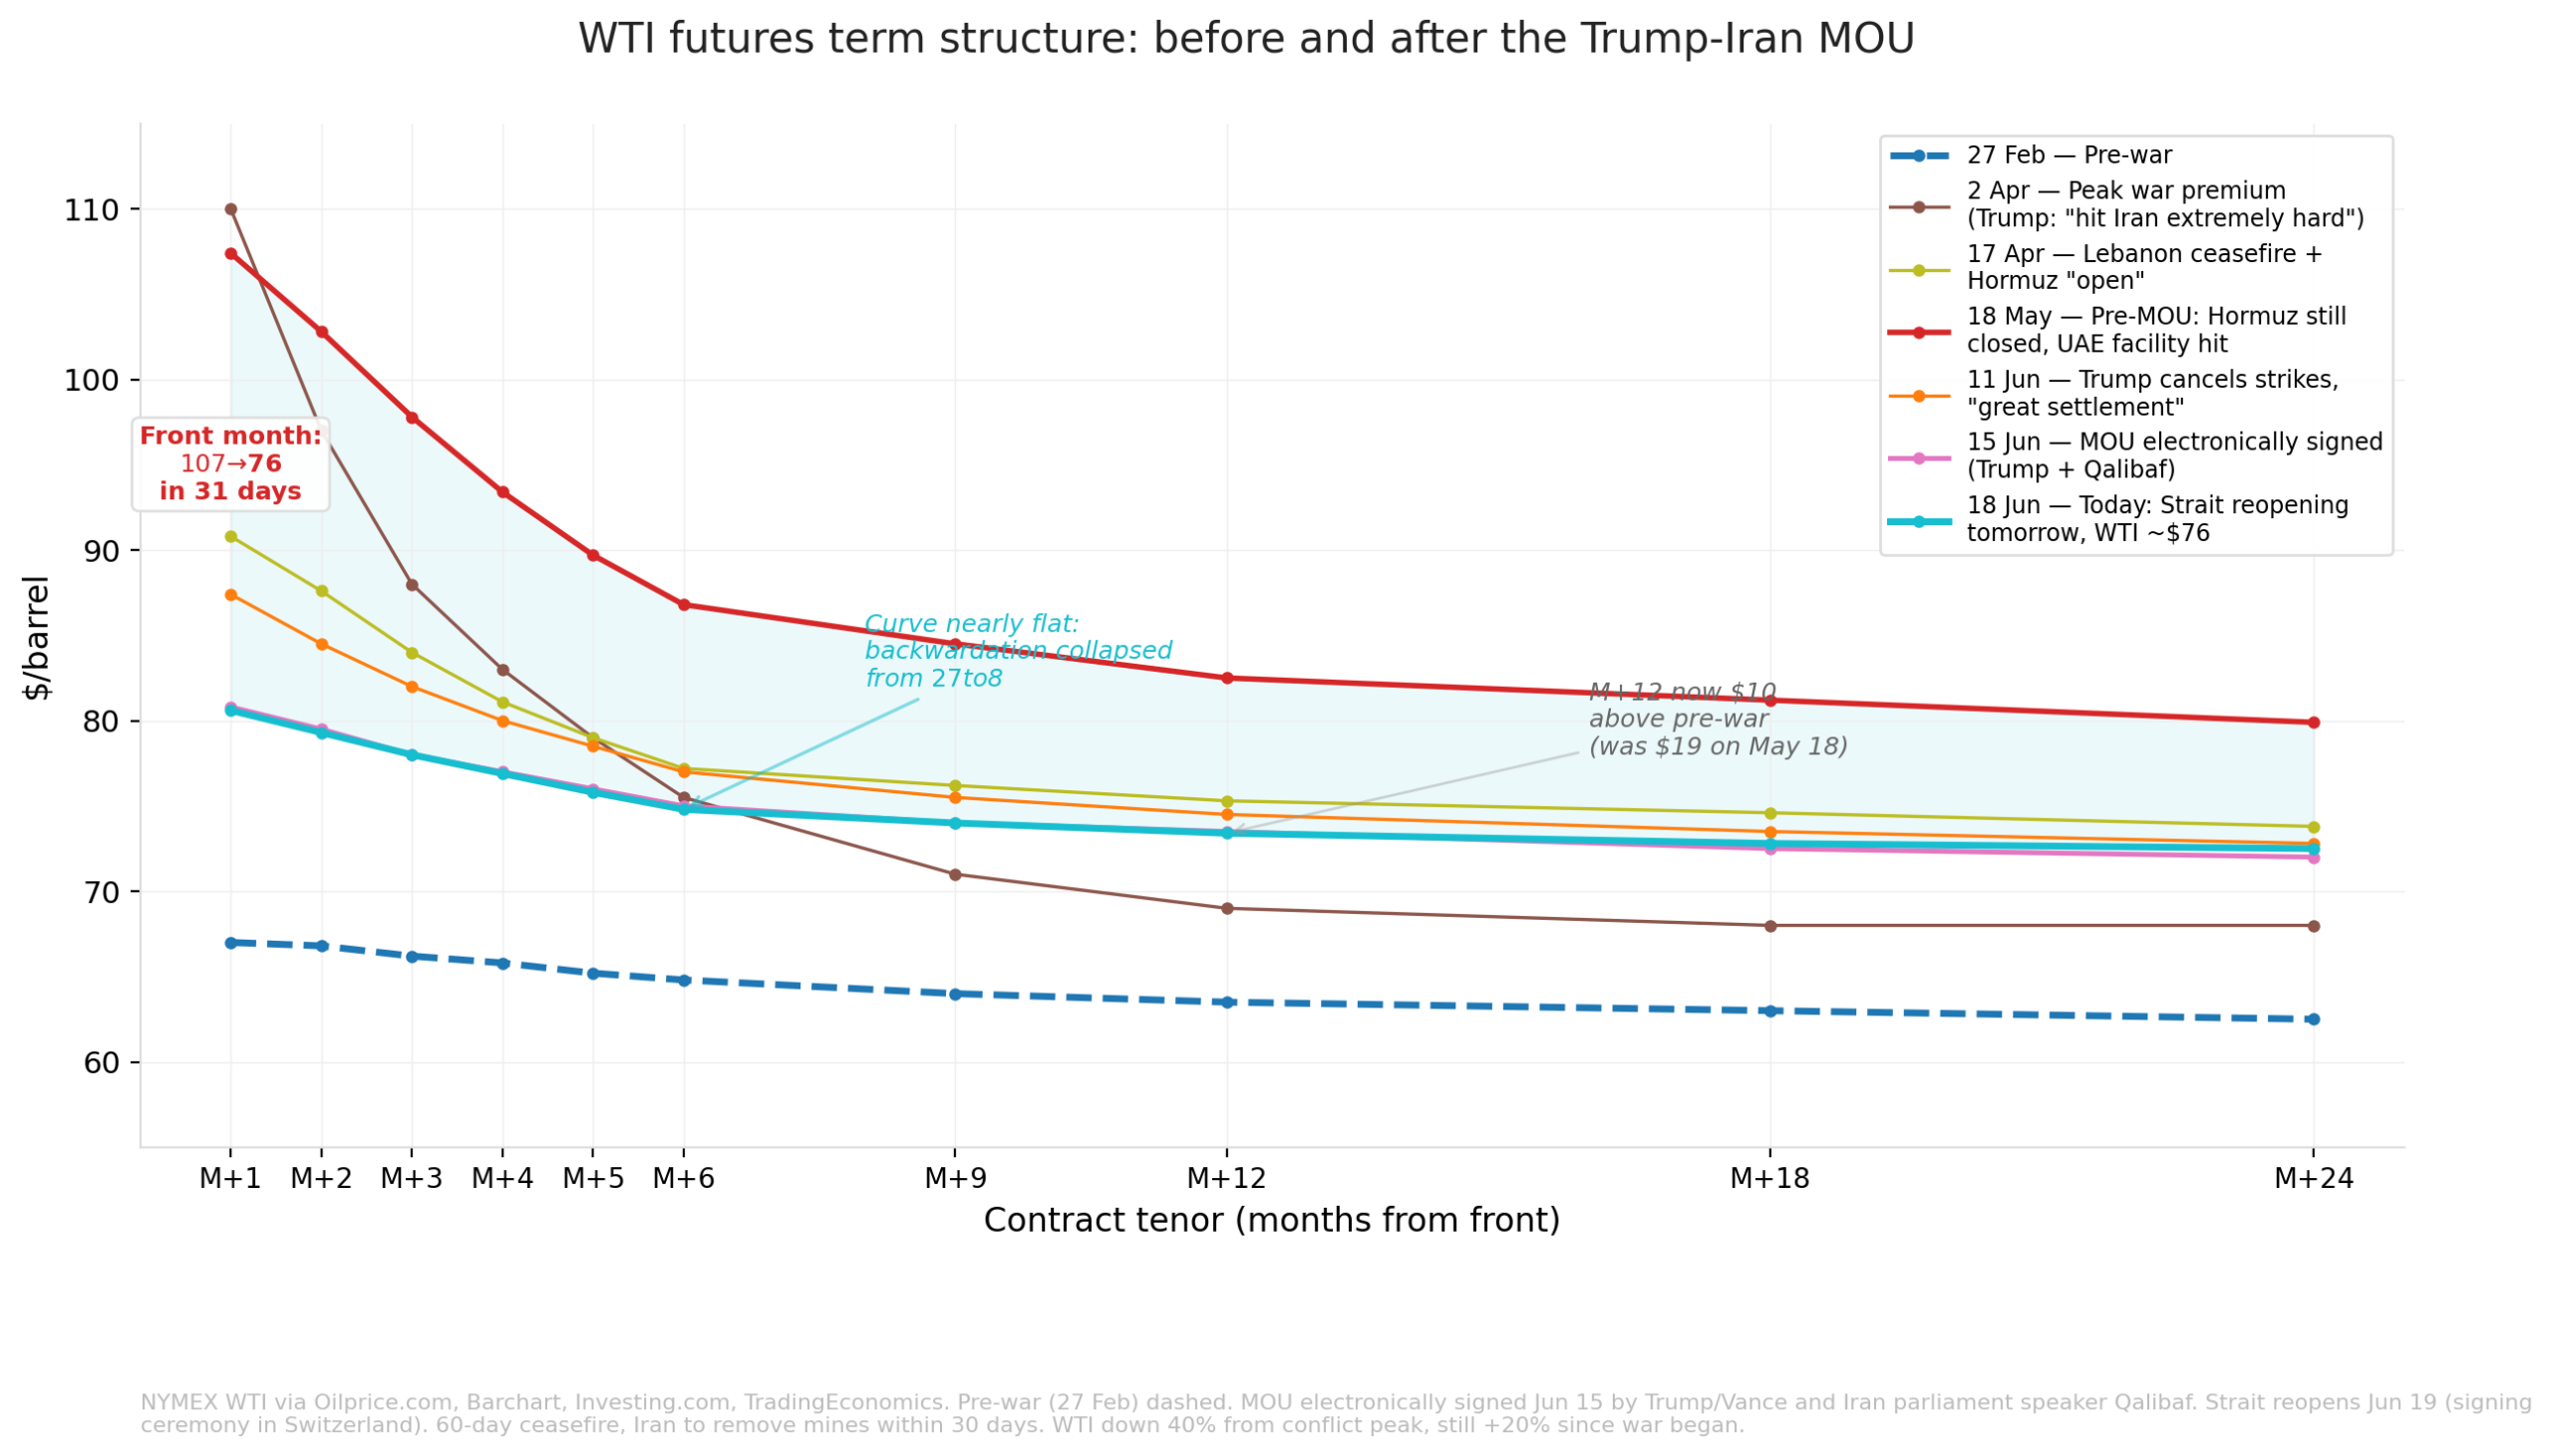
The repricing has been concentrated almost entirely at the front of the curve. The front-month contract has fallen from around 107 dollars ahead of the deal to 76 dollars, a decline of 29 per cent, and now trades roughly 40 per cent below the conflict peak reached in early April. The back end has barely moved and is converging towards the pre-war strip, leaving the curve far flatter than at any point since the strait was closed. The shape tells us the market reads the shock as an acute supply interruption that is now unwinding. With the long end anchored close to where it traded in February, investors are pricing the normalisation of flows without a return to the scarcity premium that defined the spring.
Though global crude benchmarks heavily influence local retail fuel prices, the path back down tends to be far less responsive than the climb upwards, a pattern long documented in pump pricing and often described as rockets and feathers. As we noted in the previous blog, oil inventories and tax cushions have helped to mitigate the supply shock for many countries, and the same buffers now slow the pass-through of cheaper crude to consumers. A closer look at Turnleaf’s high frequency fuel indices shows a mixed response when plotted against available reserves that continue to be drawn down (Figures 2 and 3).
Figure 2
United States retail diesel and gasoline prices against crude oil inventories, last five years (Macrobond and Turnleaf Analytics).
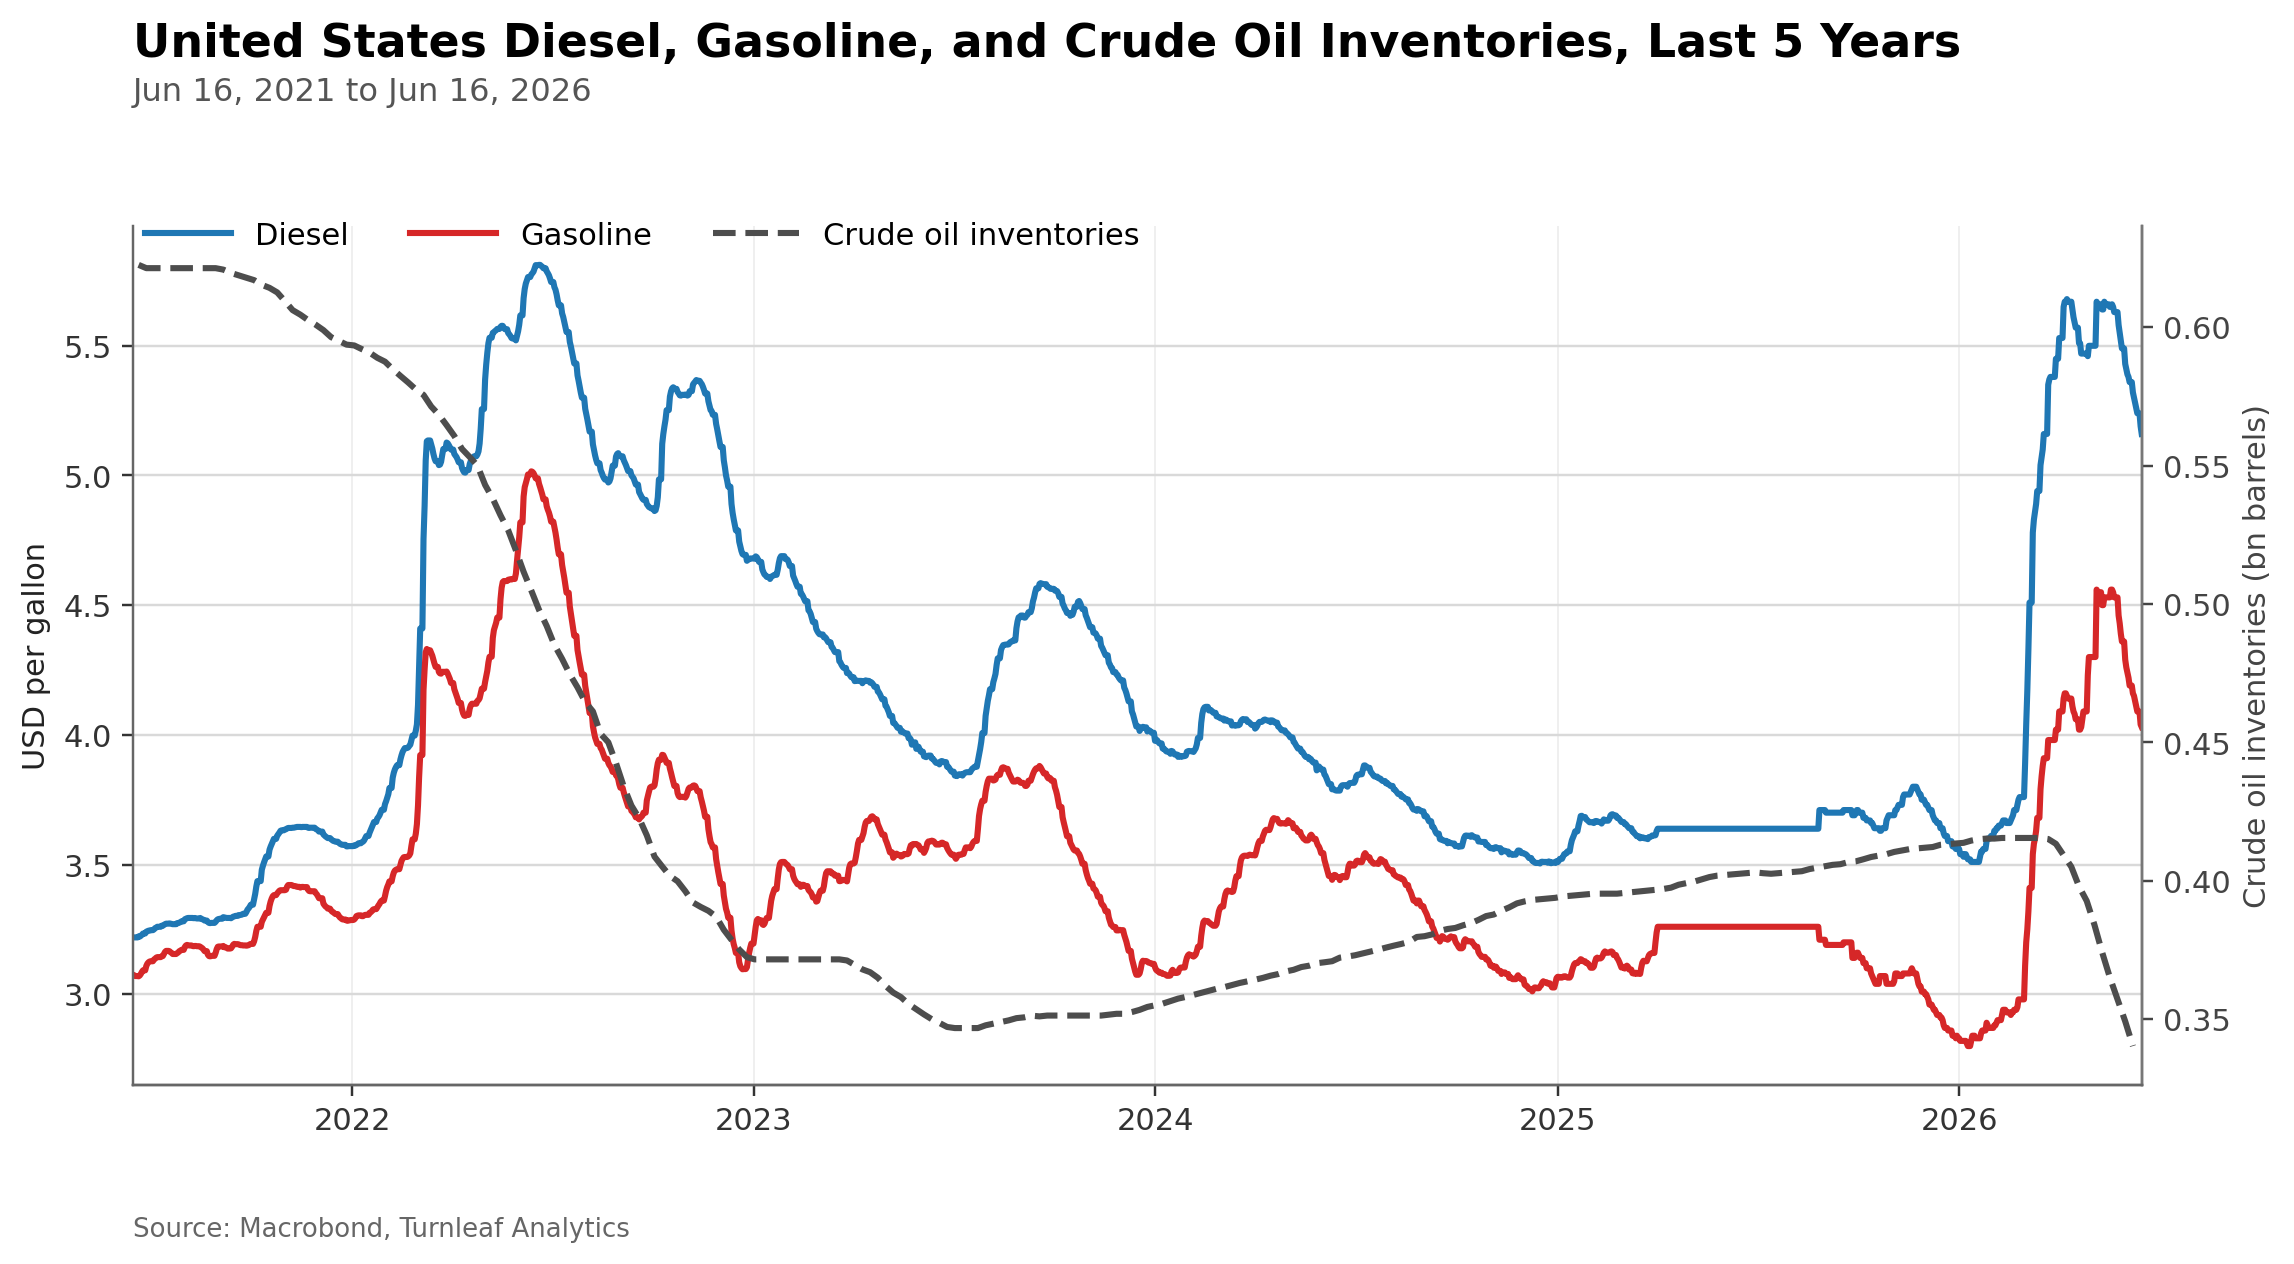
Figure 3
United Kingdom retail diesel and gasoline prices against crude oil inventories, last five years (Macrobond and Turnleaf Analytics).
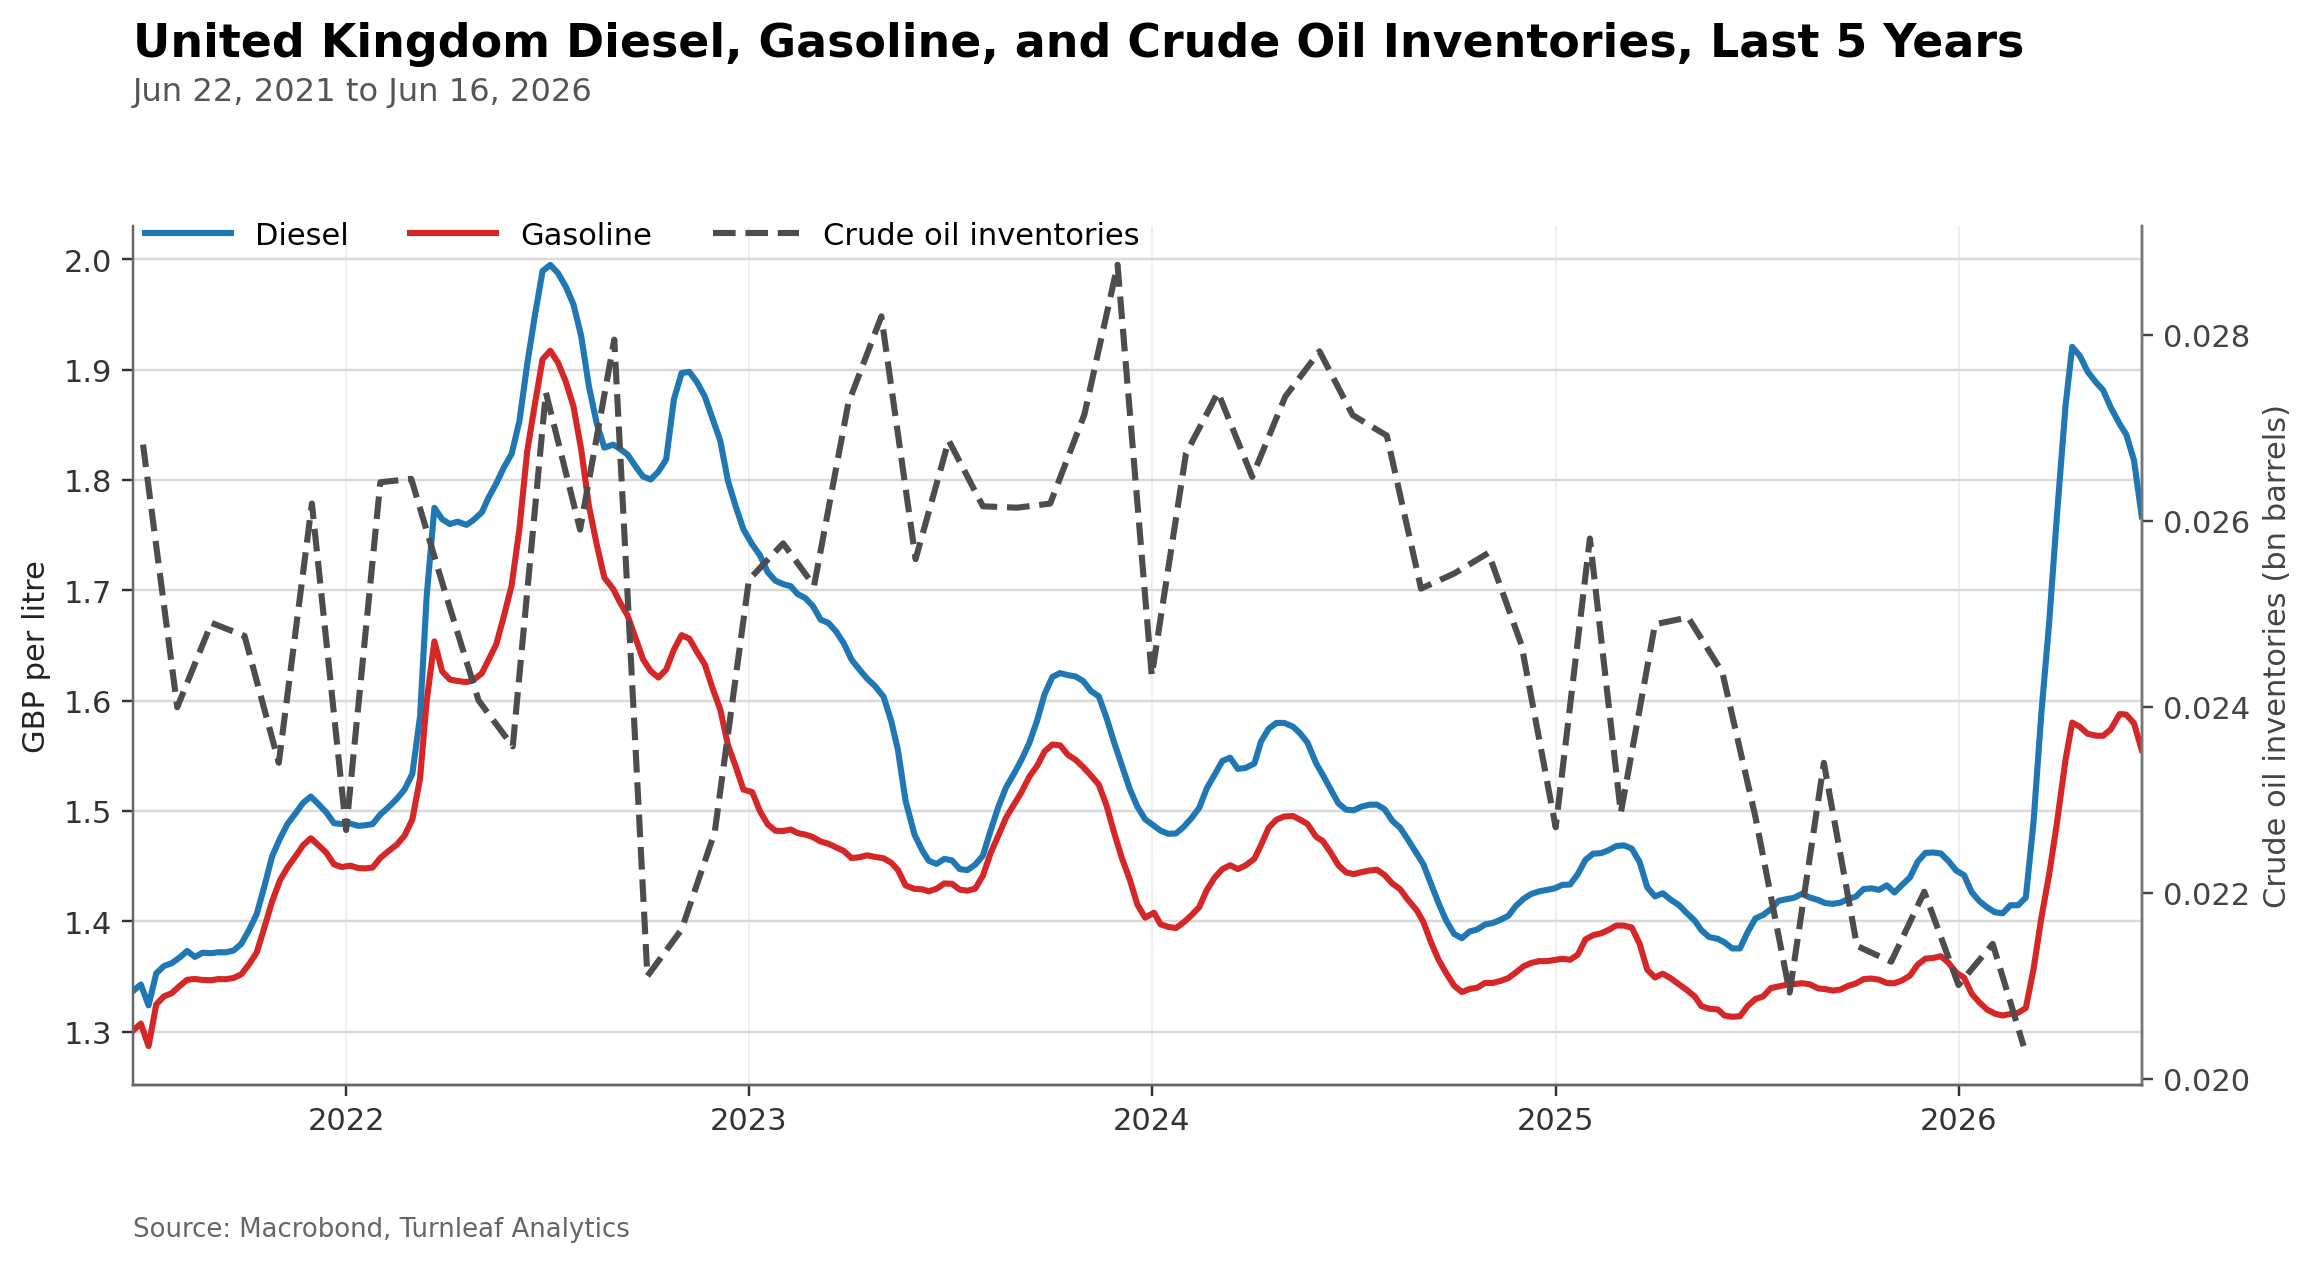
Both panels show the same dynamic. Retail diesel and gasoline spiked through the spring as the conflict escalated, while crude inventories, the dashed line, were drawn down hard to meet demand and now sit near the bottom of their five-year range, with the recent US draw among the steepest in the series. Retail prices have since eased only modestly and remain well above pre-shock levels, and in the United States the national average gasoline price has only just slipped back below four dollars. The inventory position is what the futures curve does not capture. Stocks this depleted have to be rebuilt, and restocking is itself a fresh call on crude that supports prices and slows the fall at the pump. The buffer that cushioned the shock on the way up becomes a source of demand on the way down. Set against sticky retail margins and the policy support layered on during the worst of the shock, this points to a slow and incomplete disinflation in retail fuel even as wholesale crude falls.
How Will This Affect Turnleaf’s Forecasts?
We will refresh all affected models over the coming days. Our U.S. 12-month inflation curve has fallen since last week, but recent news and futures pricing suggest little change at the long end (Figure 4 – see our latest Substack, here). As a result, medium-term energy assumptions are moving only modestly despite lower near-term prints. We therefore do not expect the shock to unwind in the short term. The disinflationary impulse from cheaper crude will feed through to headline inflation across the coverage universe, but the lagged and incomplete pass-through to retail fuel, together with the buffers described above, means the effect on core measures will be more muted and slower to arrive than the headline move in oil might suggest.
Risks to the Inflation Path
The risks around this path run in both directions. To the downside for inflation, the reopening of the strait could add supply faster than the market expects. The immediate resumption of previously sanctioned Iranian exports, the release of the tanker fleet stranded in the Gulf, a more aggressive OPEC production policy and continued non-OPEC supply growth could together tip the market back into the surplus the Agency has flagged for the fourth quarter, pushing crude and eventually retail fuel lower still. Softer Chinese demand and the persistence of tax holidays in several countries would reinforce that disinflationary pull.
To the upside, the agreement remains fragile and contested. Shipping firms are cautious about returning to the strait while the threat from mines, drones and missiles persists, and any delay in clearing the waterway would keep a risk premium in prices. The durability of the agreement is far from assured given continued fighting between Israel and Hezbollah in southern Lebanon and the unresolved status of Iran’s nuclear programme. Beyond the strait, how long Russian natural gas sanctions endure, and how much of the gas infrastructure damaged during the conflict in Qatar and other regional hubs returns to service, could add fresh pressure to energy inputs even as crude falls. The eventual unwinding of the tax holidays and subsidies that cushioned the shock would also push retail prices back up independently of the oil price.
As usual, we will continue monitoring the underlying data that so often reveals the true price story.