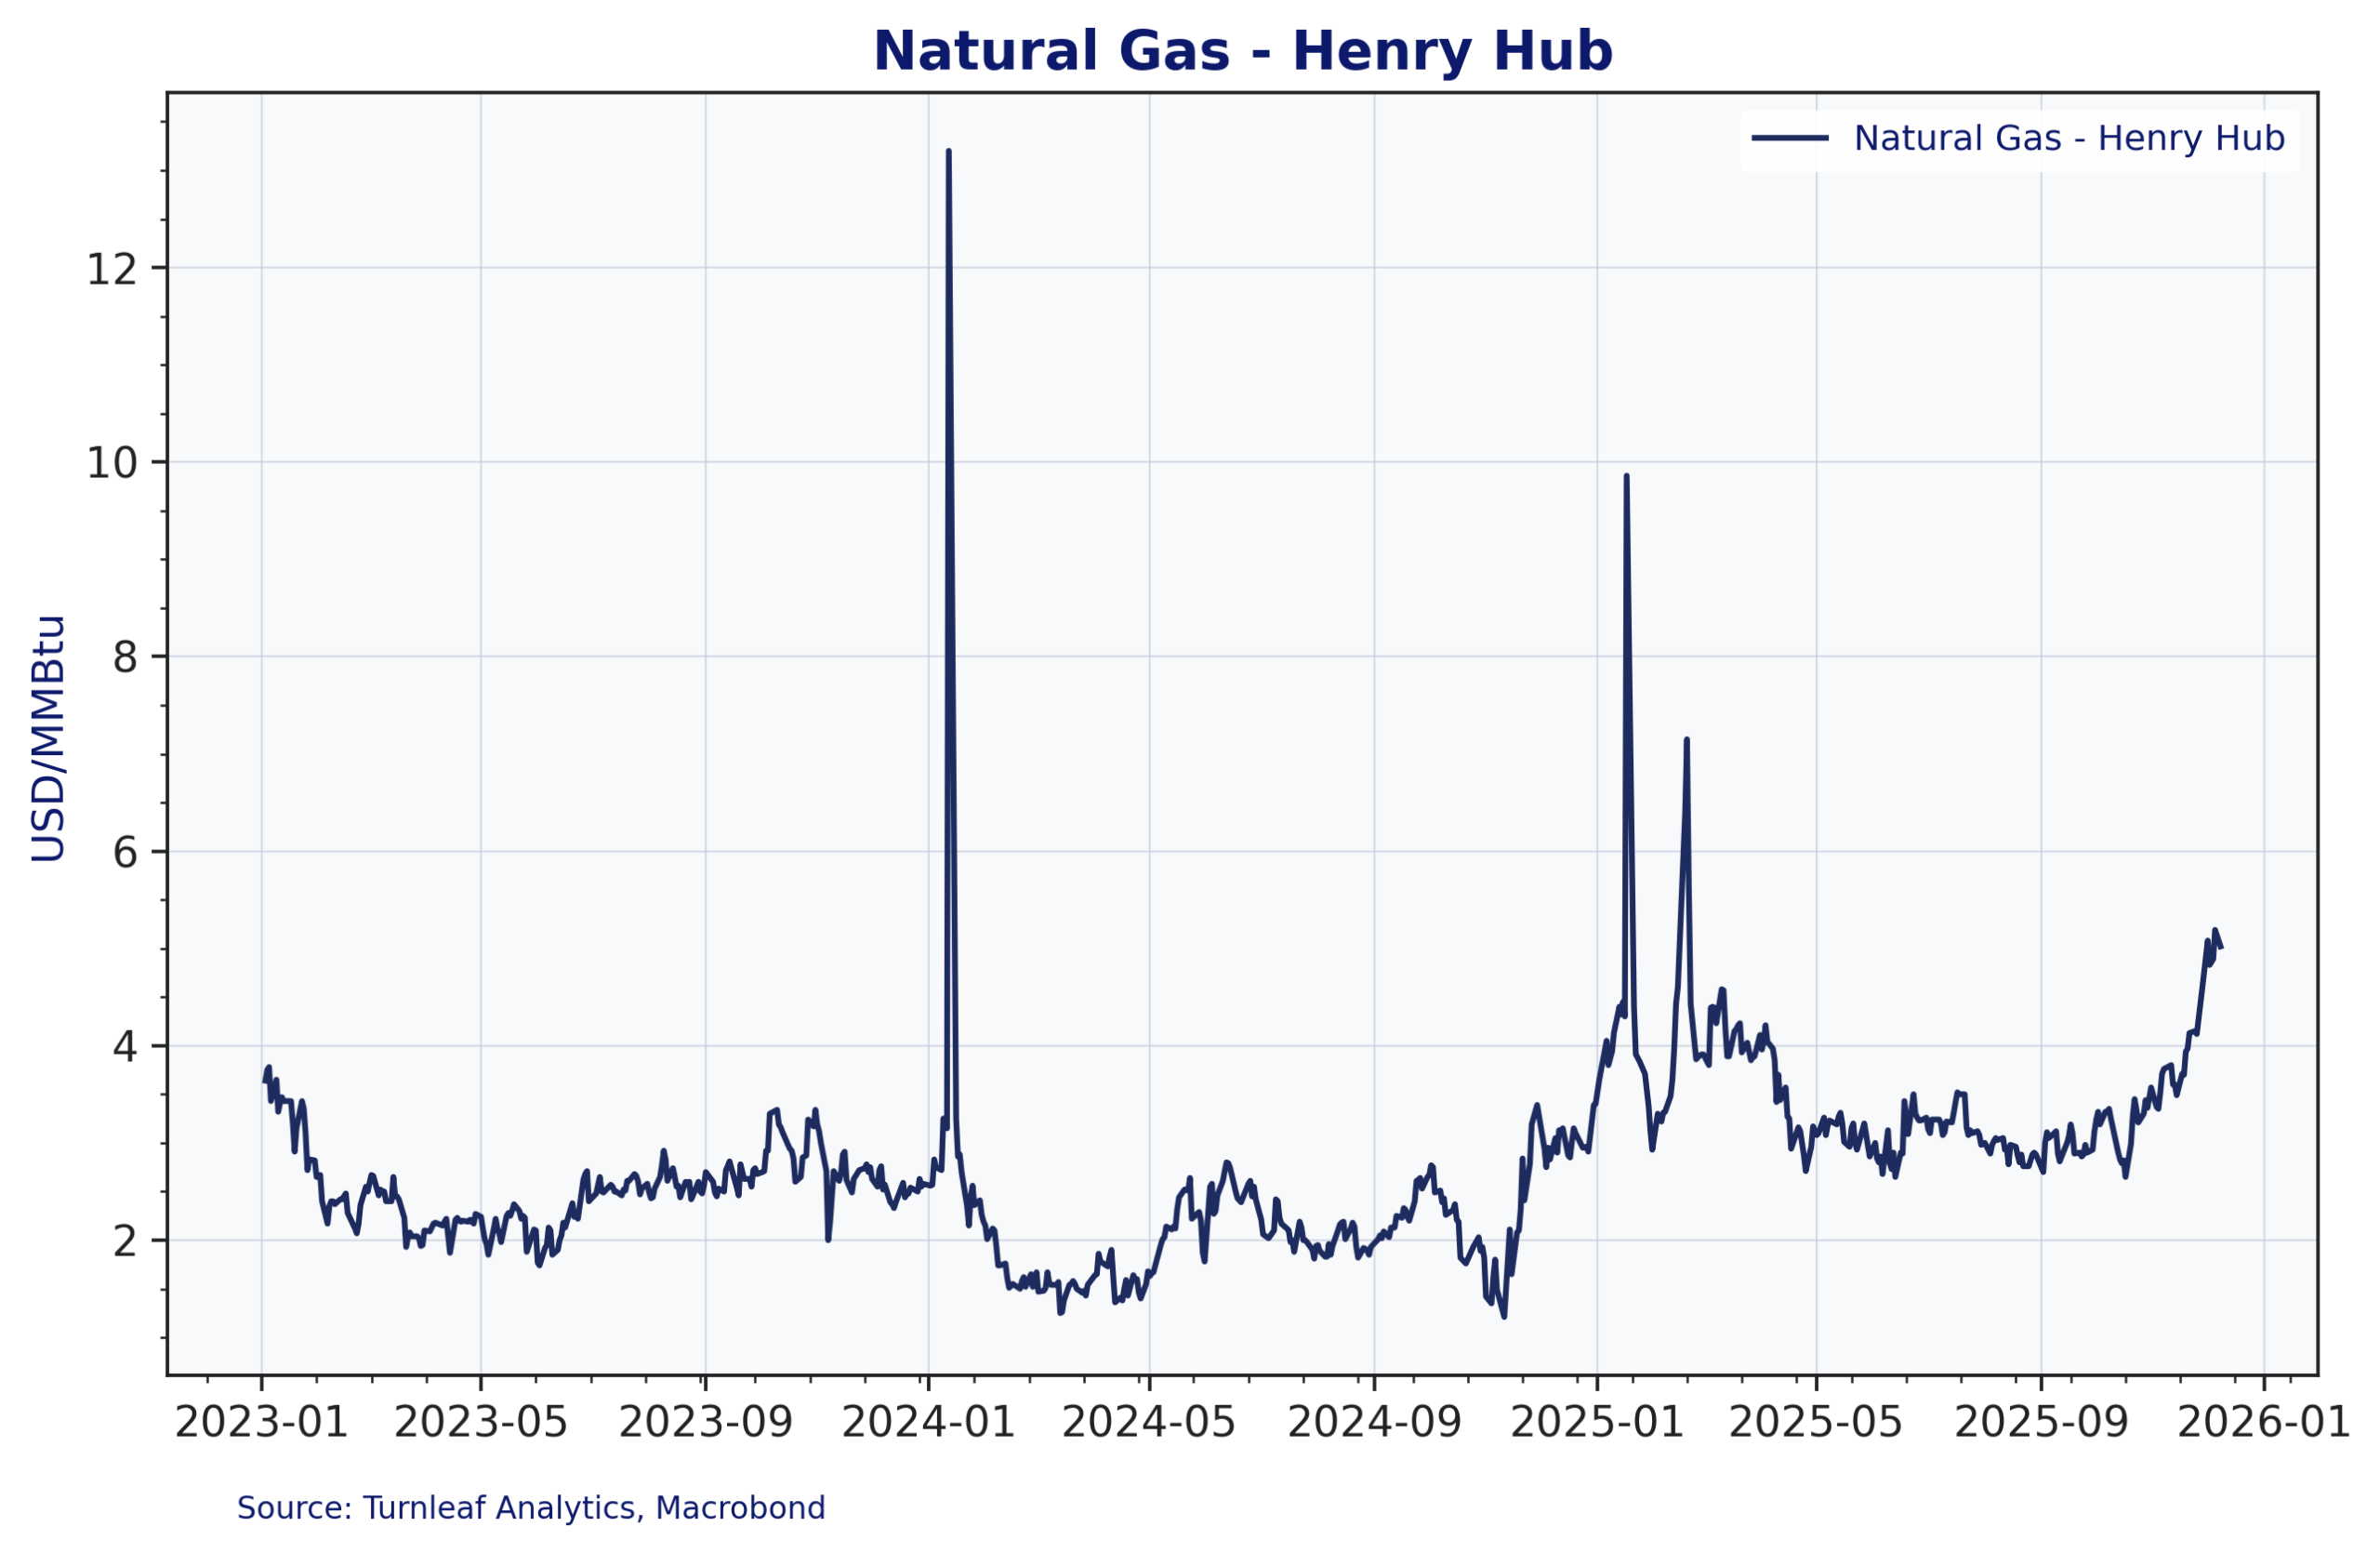
The recent spike in natural gas futures reflects market expectations of future supply constraints. Unlike past volatility driven by weather alone, this increase stems from structural imbalance like growing LNG exports, surging electricity demand (especially from data centers), and production growth that is not keeping pace. In early December Henry Hub spot prices were close to 4.9 dollars per MMBtu and near-term futures were around 5 dollars, the highest level since December 2022 (EIA Weekly, Dec 4) (Figure 1). This futures curve shift raises utilities’ expected fuel costs, which will eventually pass into regulated gas and electricity tariffs. Turnleaf’s model responds to these regulated tariff adjustments rather than daily spot market moves, meaning the inflationary signal from the futures market appears with a lag.
Figure 1
Three major drivers underpin this upward movement in prices:
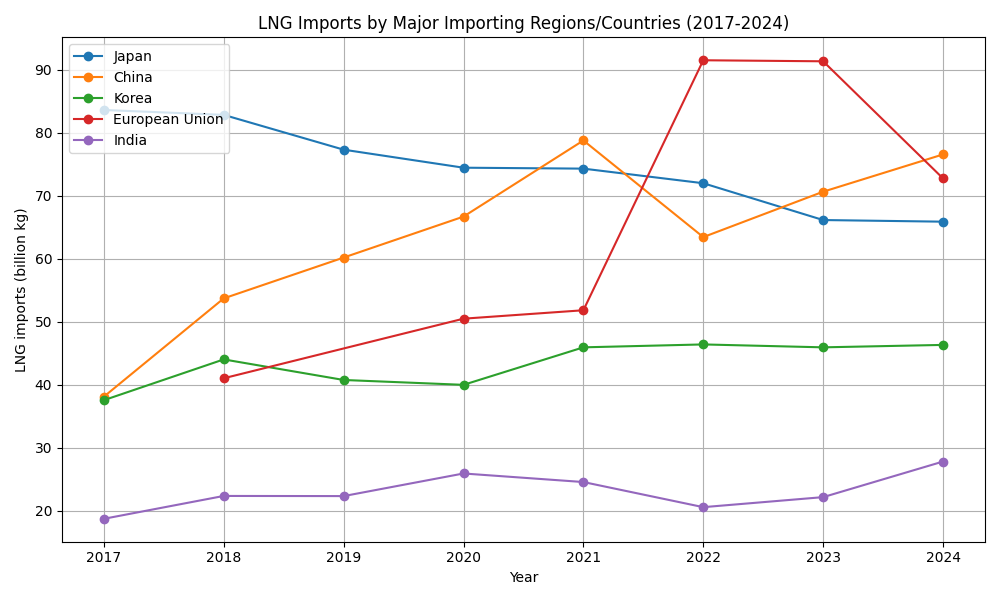
1. Rising LNG Exports – As new LNG export terminals come online, growing overseas demand, particularly from Europe, is drawing an increasing share of US natural gas into global markets, placing additional upward pressure on domestic prices (Figure 2).
Figure 2
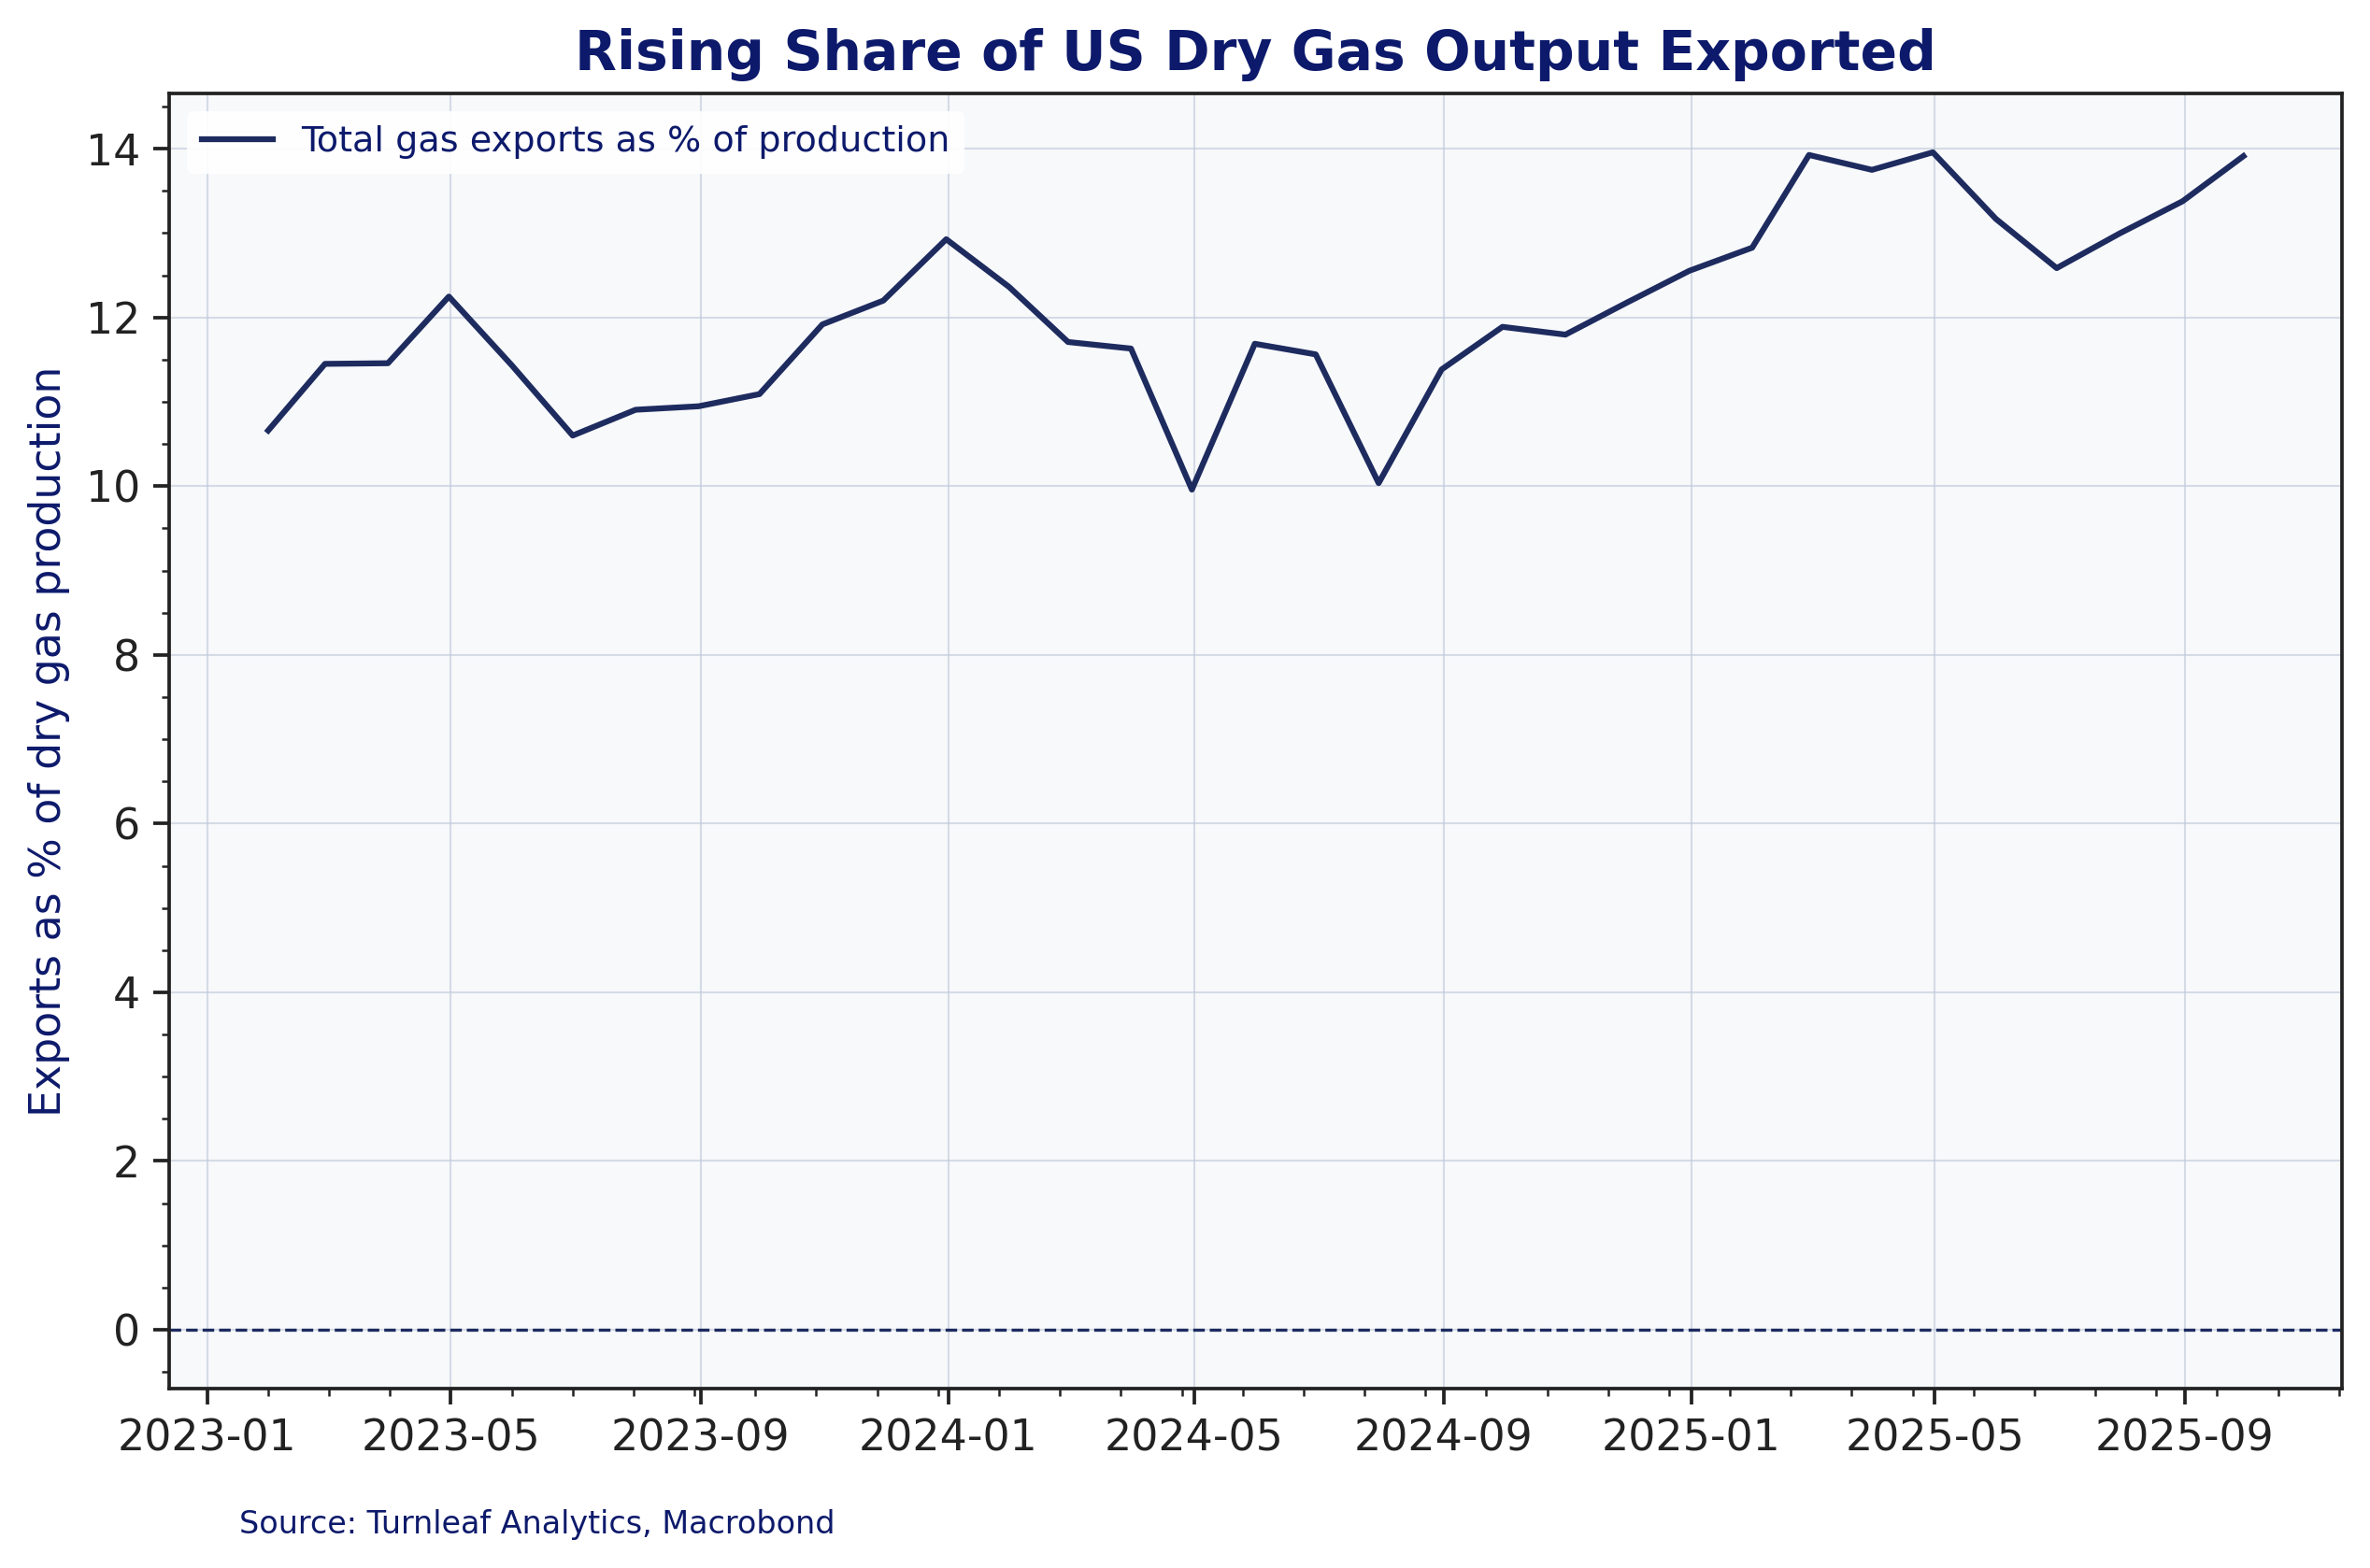
By late 2026, LNG exports are projected to add approximately 2.1 billion cubic feet per day of incremental demand, further tightening the domestic supply–demand balance (Figure 3).
Figure 3
2. Flat Production Growth – While US natural gas production is projected to increase modestly (~1% YoY in 2026), it fails to match the accelerating demand from both exports and power generation.
3. Weather & Storage – Colder-than-expected December temperatures pushed the EIA’s winter forecast up by $0.40/MMBtu. While storage entered winter 4% above the five-year average, withdrawals in December are expected to be 28% above normal, reinforcing near-term tightness.
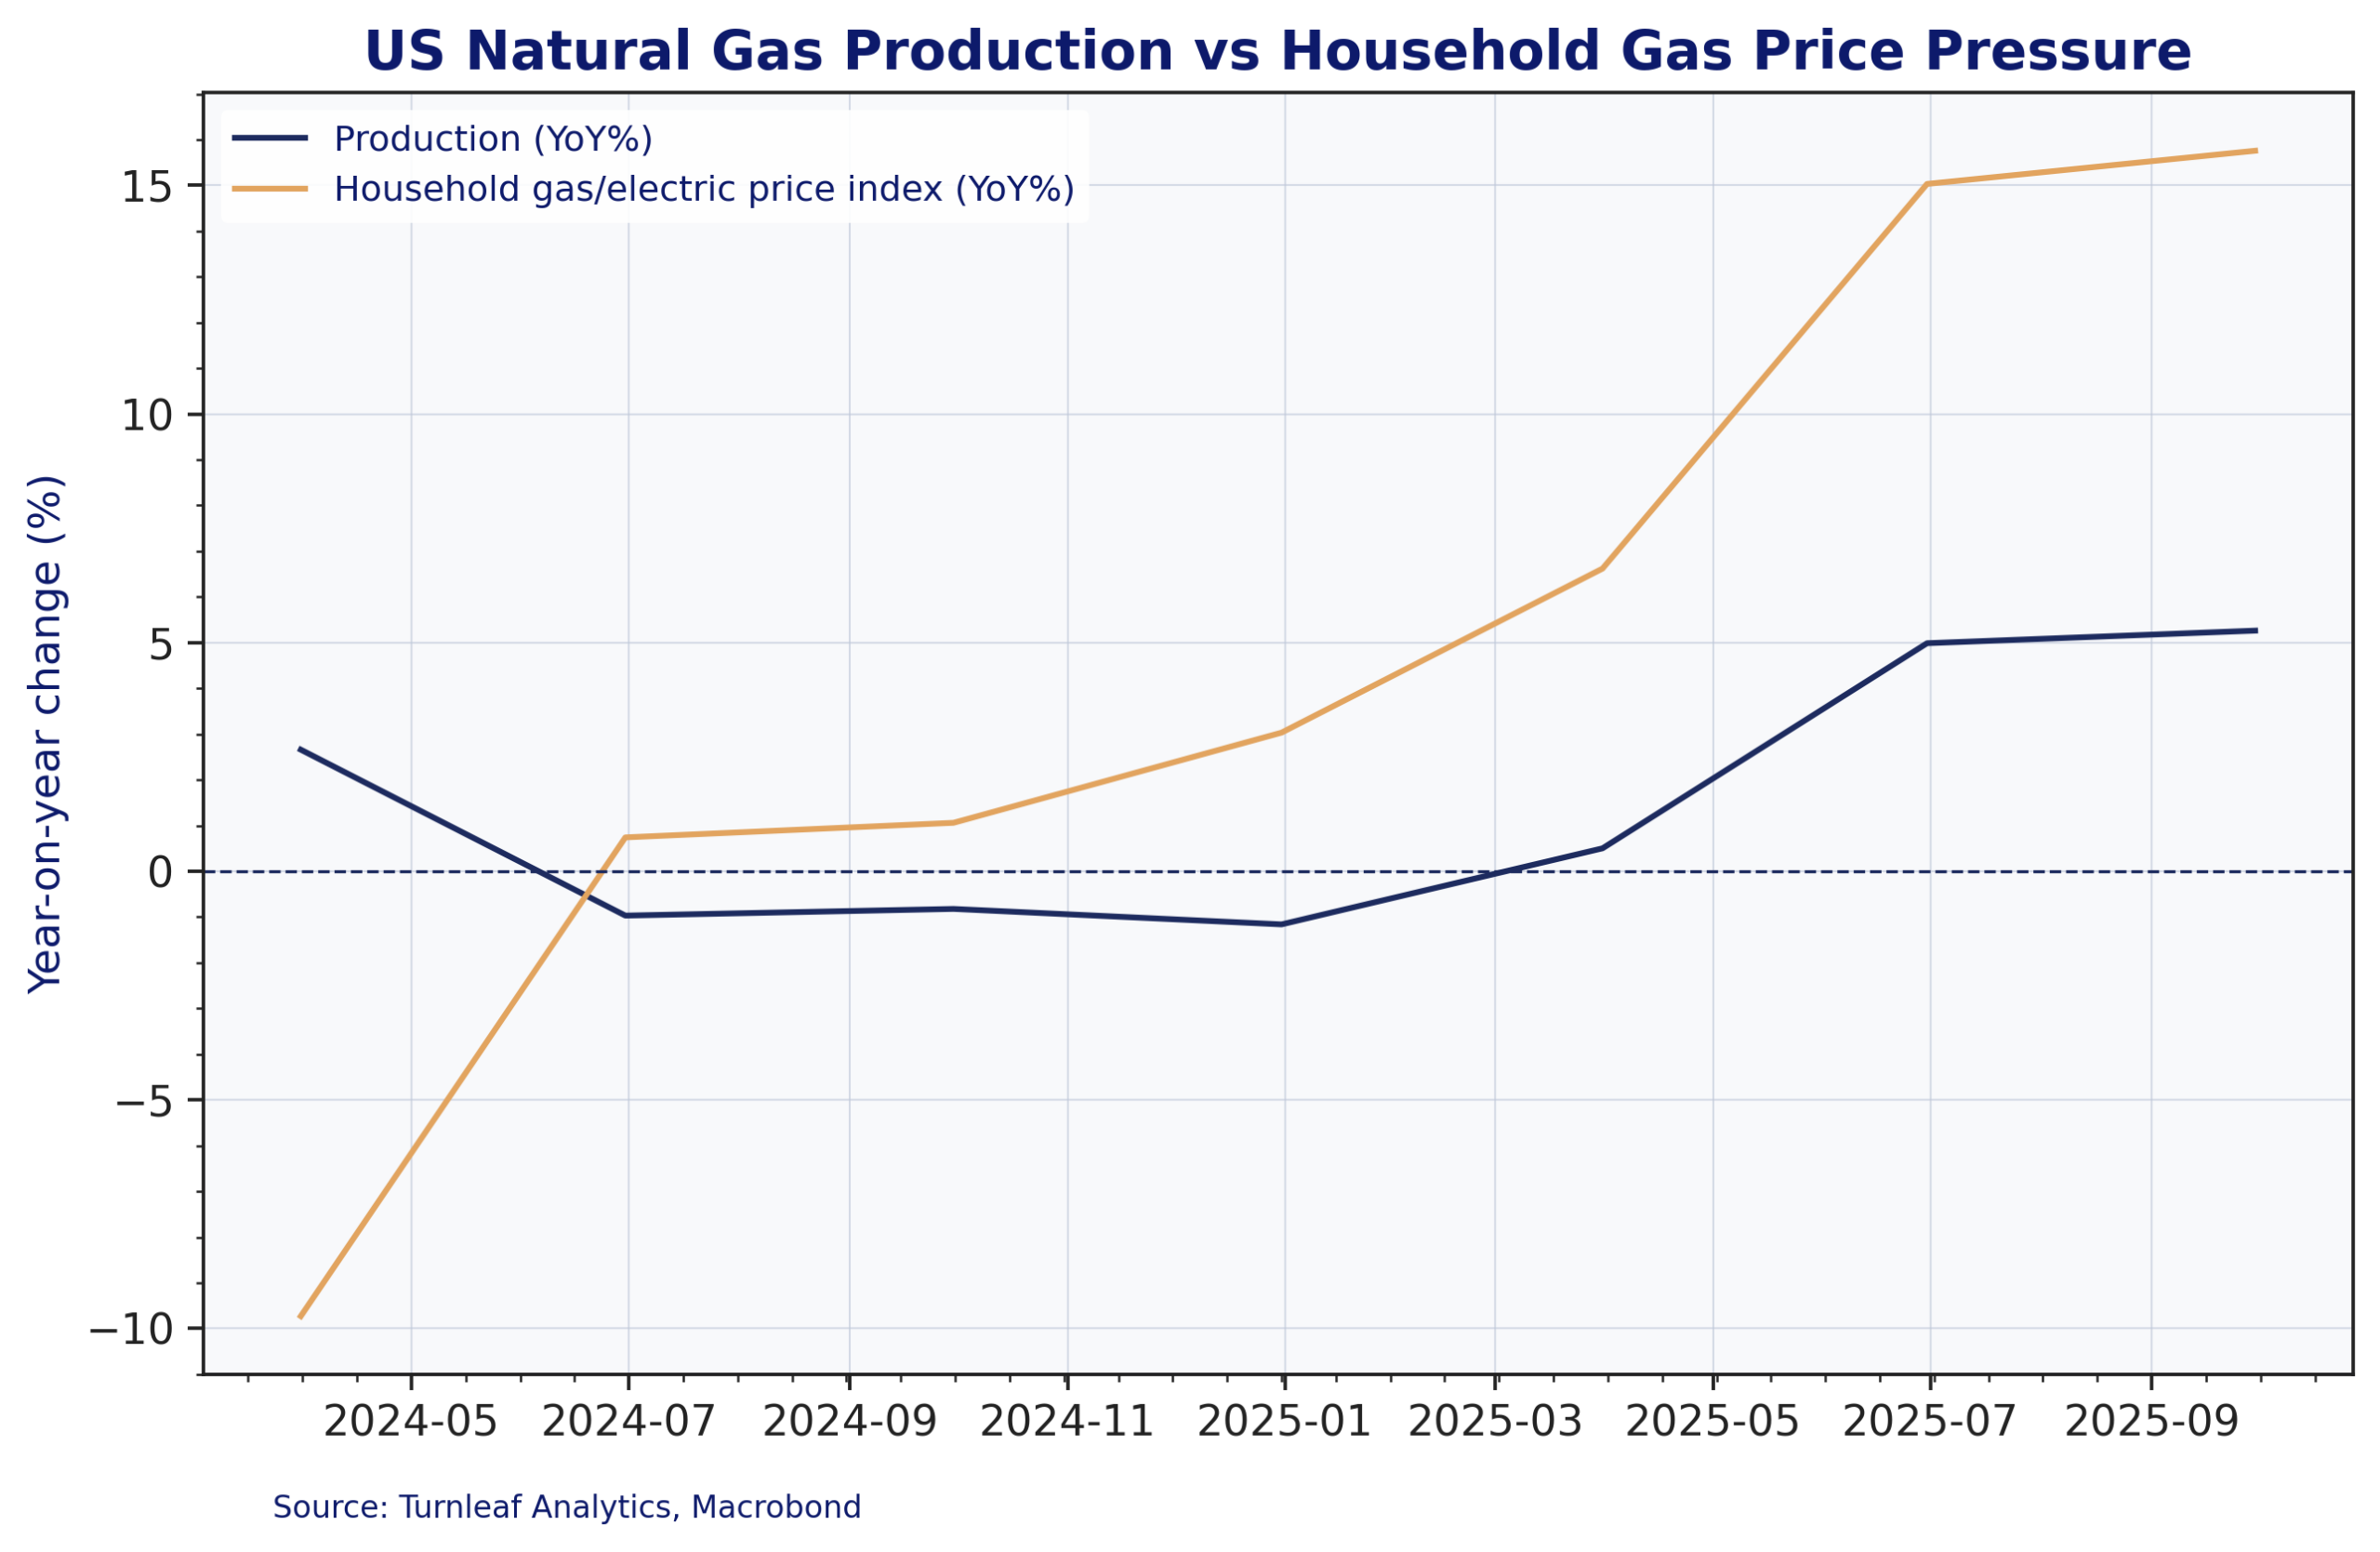
Figure 4 shows how this imbalance is starting to reach households. US natural gas production grows only modestly through 2024 and is about 5 percent higher YoY by late 2025, while the household gas and electricity price index moves from a 10% decline in early 2024 to gains above 15% by autumn 2025. The growing gap between weak supply growth and rising household prices reflects stronger demand from LNG exports and the power sector, and the way regulated fuel-cost mechanisms pass higher wholesale prices into retail tariffs with a delay rather than in one step.
Figure 4
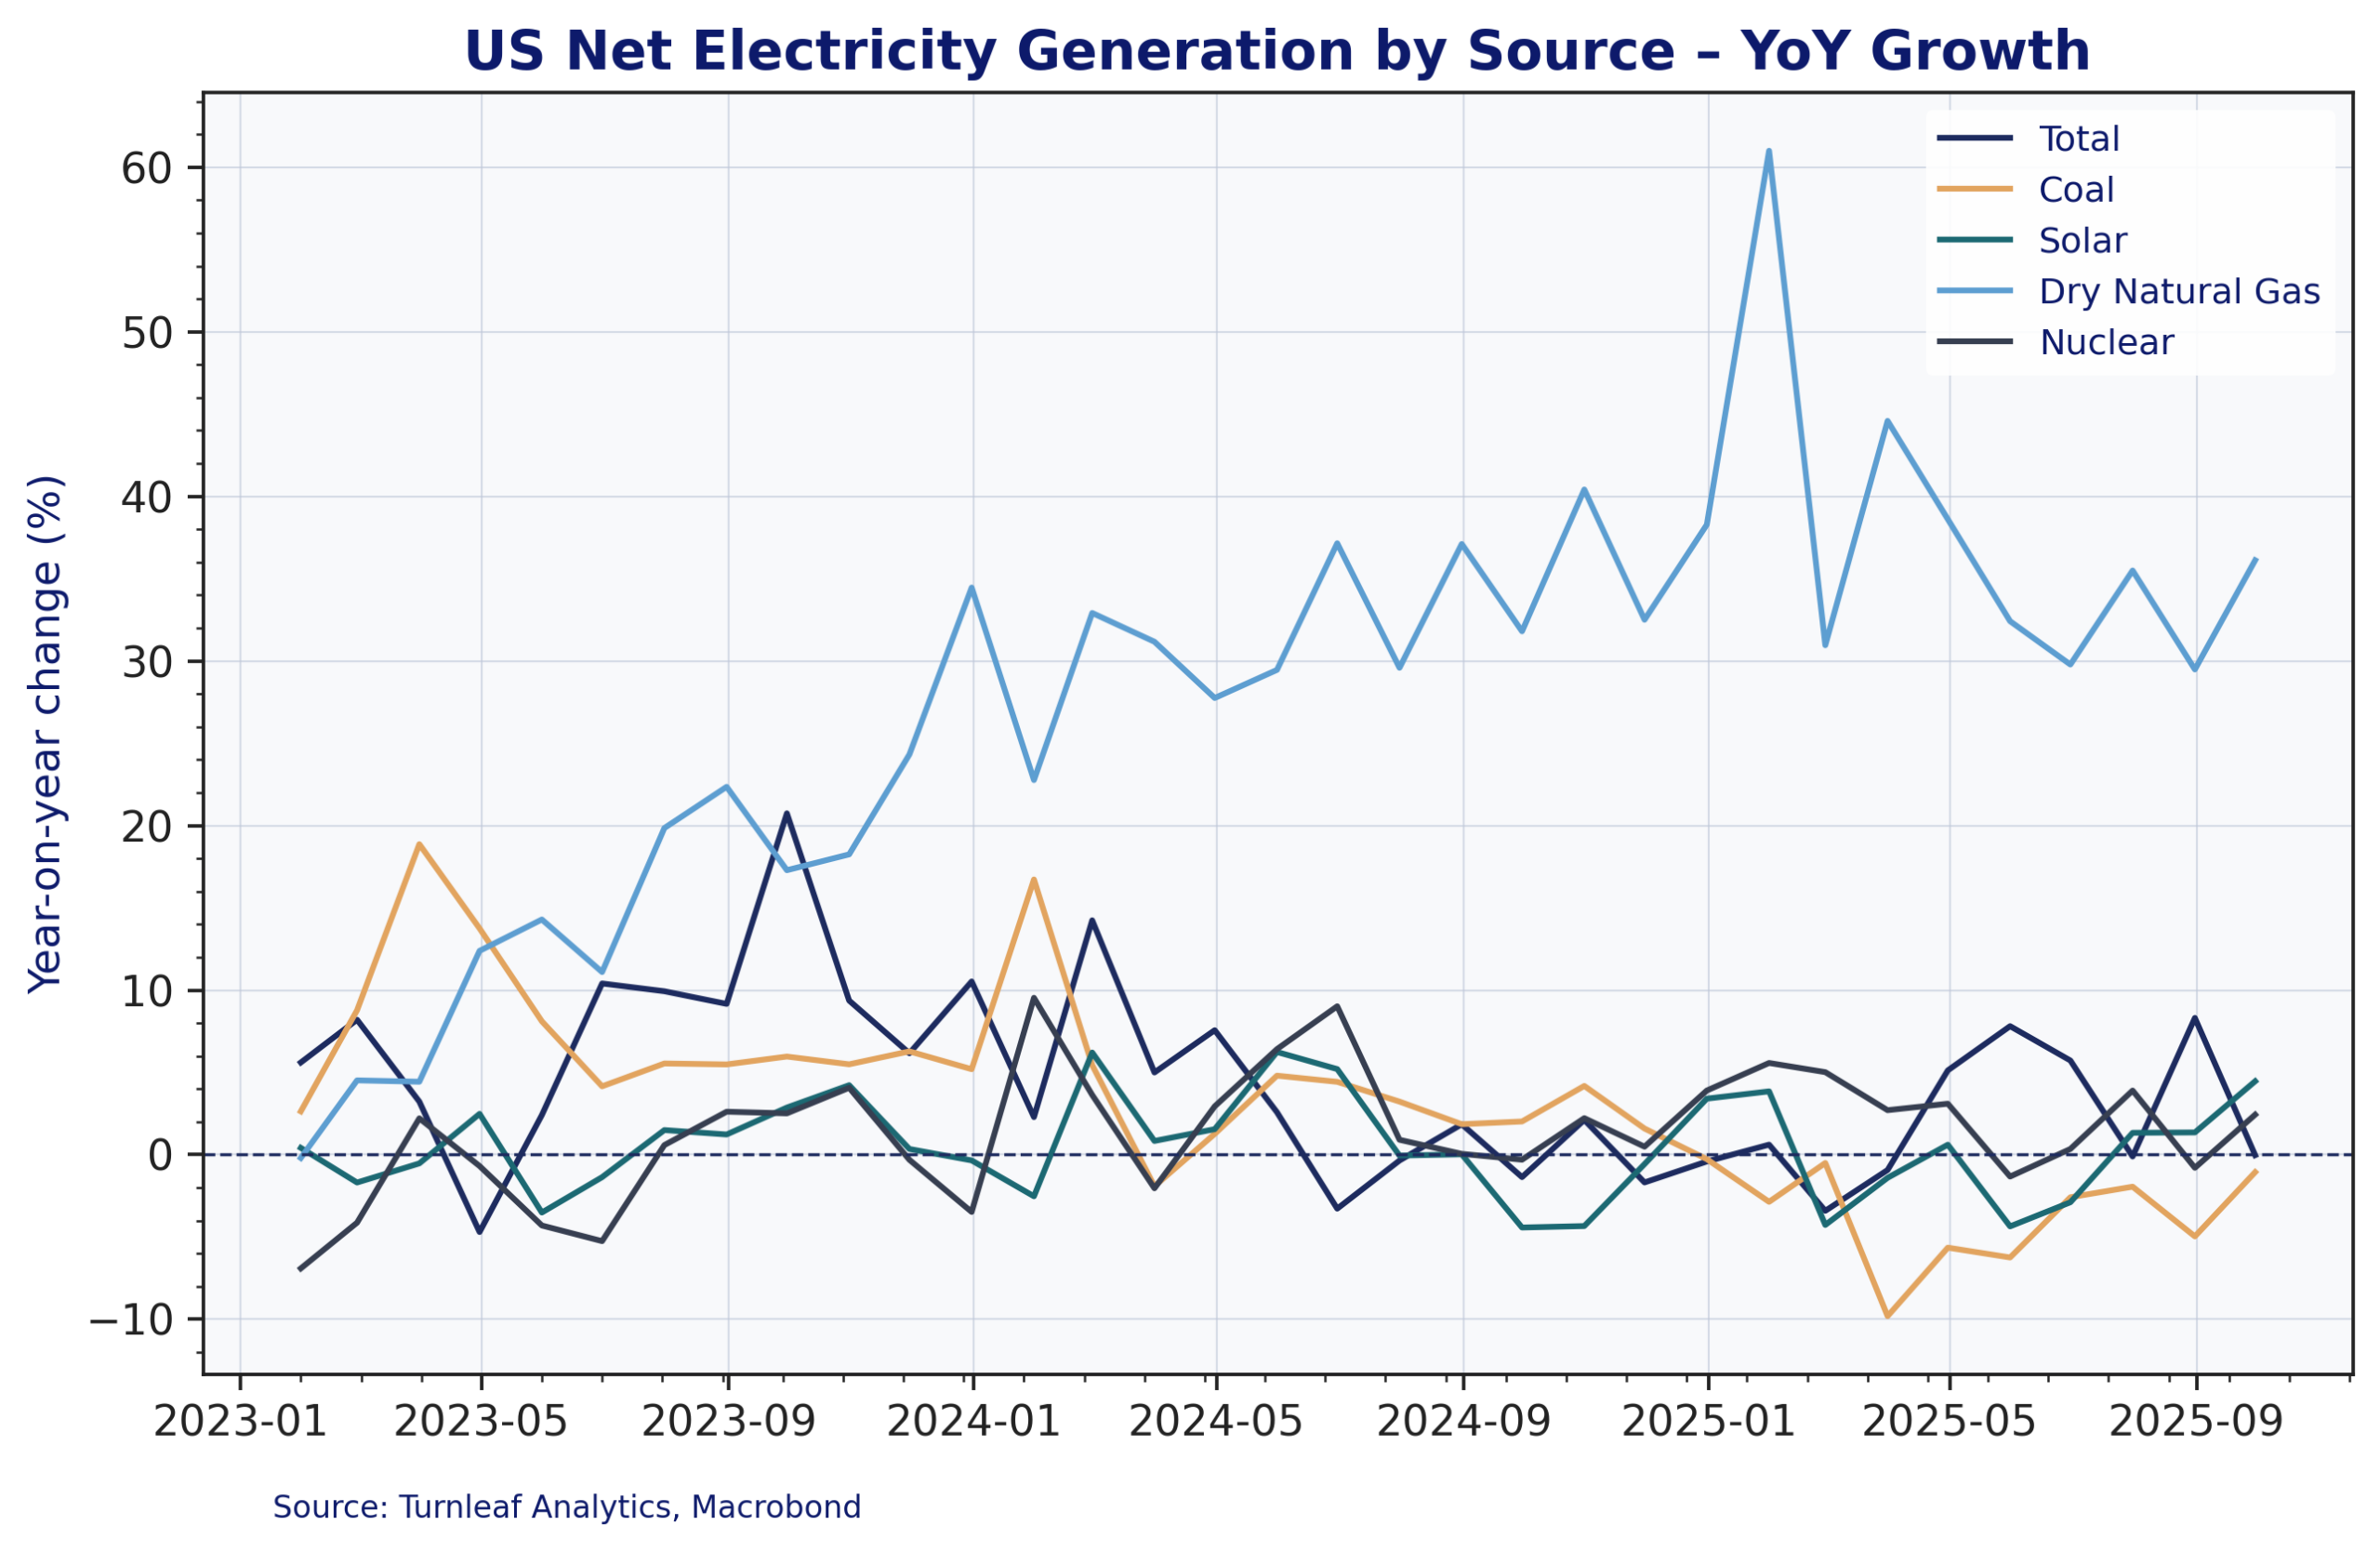
Natural gas supplied about 43 percent of US electricity in 2024 and remains the dominant fuel (Ember 2025). Figure 5 shows the changing generation mix. Solar output rose 27 percent and wind generation grew 7 percent, together reaching a record 17 percent share of total generation, while coal fell to a historic low of 15 percent. Even with strong growth in renewables, gas-fired generation still increased 3.3 percent because overall electricity demand expanded, which kept gas in the marginal price-setting role.
Figure 5
This demand-supply gap is also passed through to consumers via regulated utility mechanisms with natural gas prices feeding directly into electricity rates. Since utilities hedge fuel costs through futures, rising forward prices push expected costs higher, and these eventually flow into retail tariffs as state regulators revise fuel-cost allowances. The lag here is usually 6–18 months for gas, and 3–12 months for electricity.
Electricity demand rose by about 3% in 2024, ending over a decade of stagnation. This shift is largely driven by data centers, which consumed around 4% of total US electricity use. With demand from AI-driven workloads expected to grow rapidly, monitoring the Data Processing PPI will be increasingly important, particularly following the cancellation of the October 2025 release.
Electricity has a much larger weight in the CPI basket (2.0–2.5%) compared to utility gas (0.7–0.8%). Since gas-fired plants often set marginal power prices, higher gas futures are rapidly transmitted to electricity tariffs, amplifying the inflationary impact. Turnleaf’s model already detects this pressure in electricity pricing, keeping inflation fluctuating around 3%YoY into 2026.
Natural gas futures are likely to influence CPI through both utility gas and electricity channels. While gas tariff adjustments take longer, electricity prices react more quickly due to their dependence on marginal gas costs. With Henry Hub prices expected to remain elevated into late 2026, upward pressure on energy-services inflation is likely to intensify over the next year. The sustained rise in electricity prices and demand flagged by Turnleaf’s CPI YoY NSA daily model is an early warning. If natural gas prices remain persistently high or continue to climb, a likely adjustment of the forecast should be expected along with broader inflation pass-through by mid to late 2026.
To check out Turnleaf’s US CPI 12-month forecast, visit our Substack here.