Our United States CPI YoY, NSA model continues to flag two quiet but disinflationary forces: a moderate rise in unemployment and trends in disability-program flows. To qualify for Social-Security Disability Insurance, applicants must show their condition limits earnings below “substantial gainful activity”—a time-consuming step people pursue only when job prospects dim. Typically, applications fall in good times and climb in bad times. Applications are still edging lower (Figure 1), yet seasonally-adjusted unemployment has begun to creep higher (Figure 2) while small-business hiring plans fade.
Figure 1
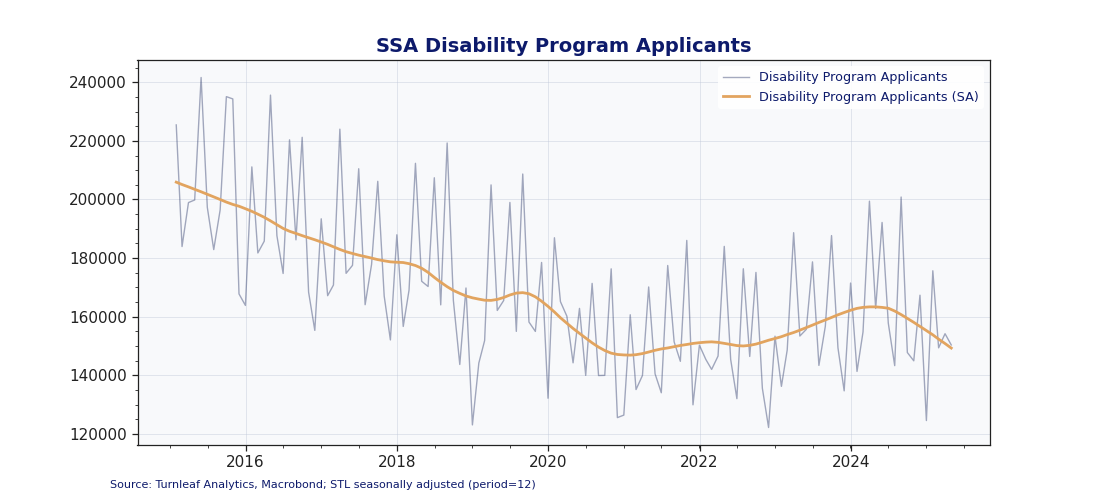
Figure 2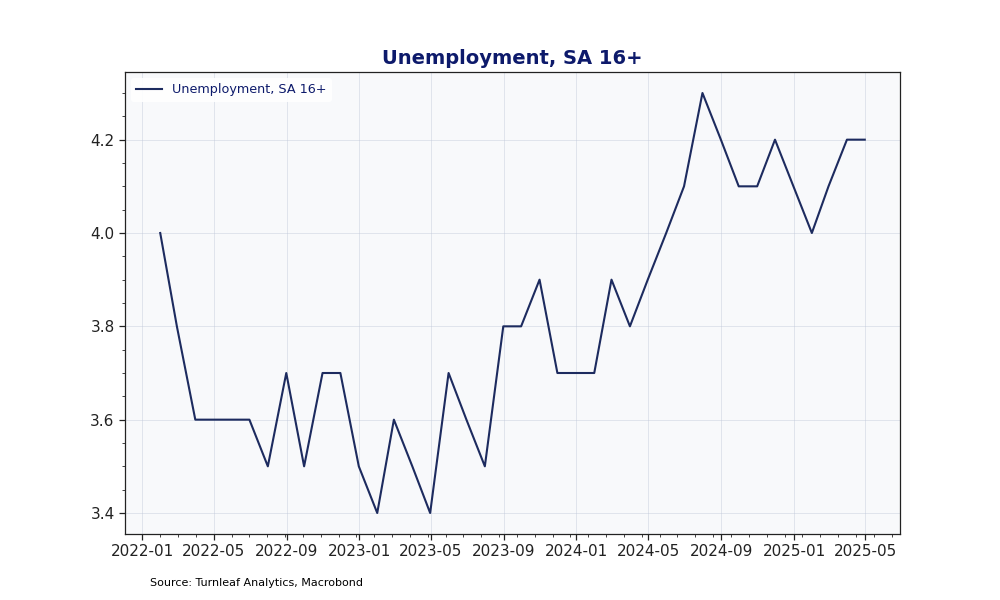
The tariff-driven recession feared by the Fed has not materialized, but lingering cost uncertainty—reflected in elevated Economic & Trade Policy Uncertainty indices—continues to pose risks to inflation. Small businesses have started hedging against this uncertainty: NFIB data reveal an increasing share of firms reporting worsening business conditions, fewer indicating it’s a favorable time to expand (Figure 3), and a declining proportion planning pay hikes or additional capital spending over the next three months (Figure 4). At the same time, workers appear increasingly cautious, prioritizing job security. These trends align closely with our model’s predictions and the insights reported in the Fed’s Beige Book. Specifically, the May 2025 Beige Book noted widespread delays in hiring, reduced employee turnover, and planned workforce reductions across several districts, all factors that collectively dampen overall economic activity.
Figure 3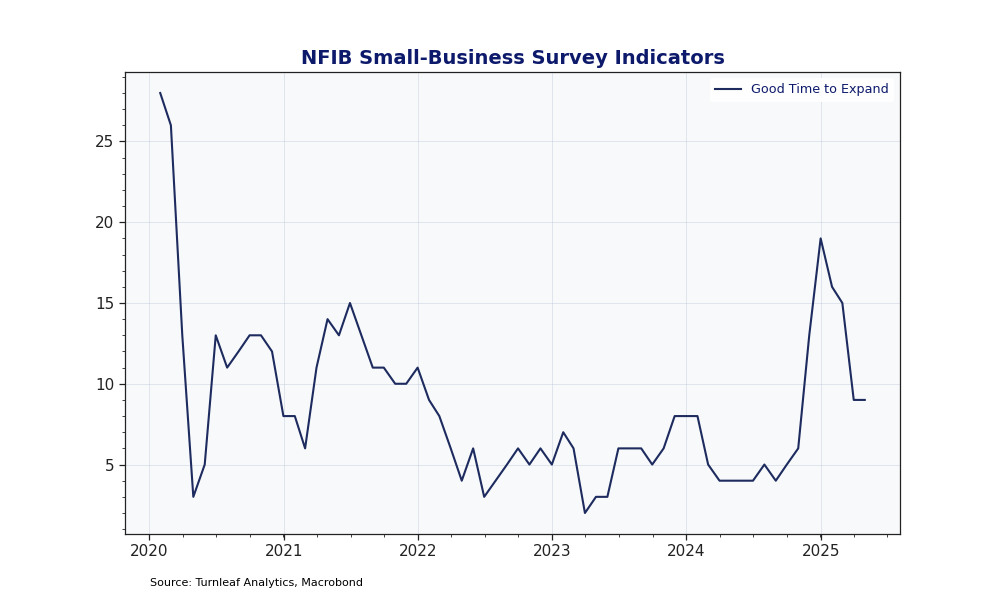
Figure 4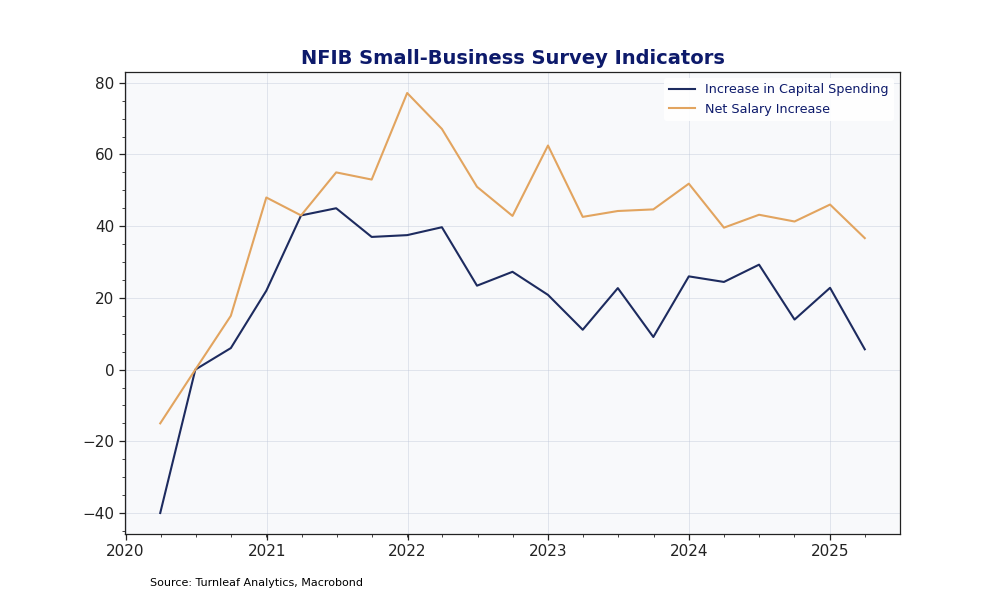
When hiring slows, workers have less bargaining power, causing wage growth—the primary factor behind rising service-sector prices—to moderate. At the same time, a weaker market pushes marginal workers to file for disability benefits. Those approved leave the labor force, but trade full wages for benefits worth roughly half as much. Ultimately, the resulting reduction in consumer demand substantially outweighs any modest impact from fewer available workers.
Higher unemployment, muted hiring plans, and any incremental rise in disability awards will put gentle downward pressure on inflation. Since May 14, 2025, our weekly forecast curve (Figure 5) has shifted downward as the likelihood of lower tariffs rises and ongoing uncertainty weakens labor‐market conditions, reducing wage‐growth pressure. The economy still looks “good” on the surface, but as tariff concerns begin to fade, these under-currents suggest the next leg of the inflation path could be drifting south, not north.
Figure 5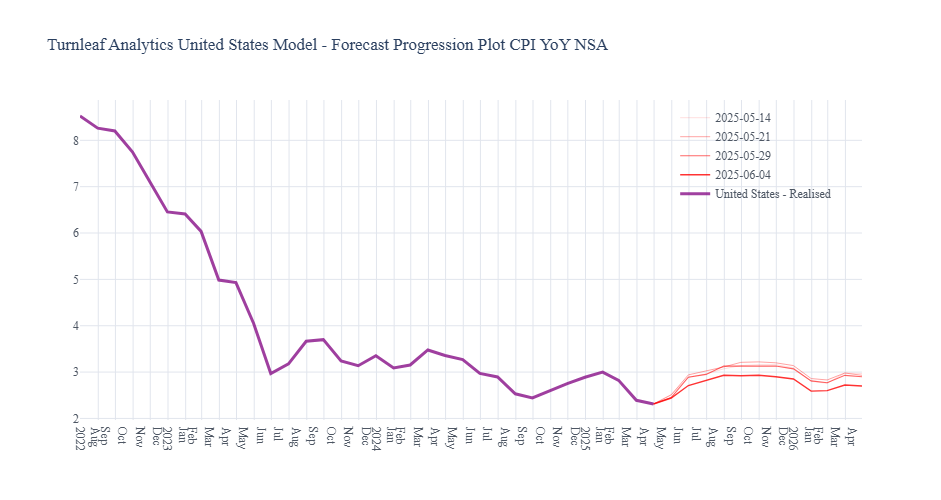
Word Cloud Contribution Plot, United States, April 2025
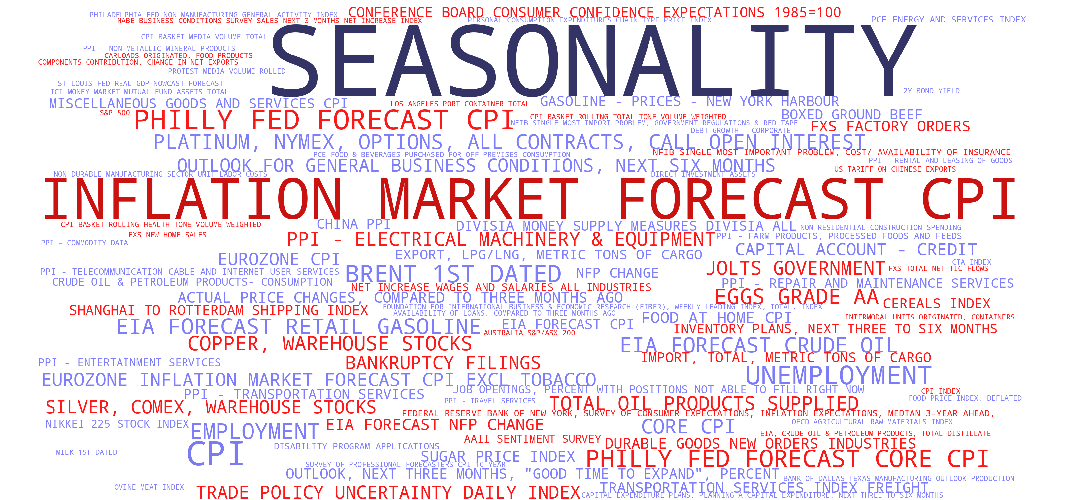
Subscribers can gain insights into the key drivers influencing Turnleaf’s CPI forecasts by examining our Word Cloud. Each term represents an economic indicator’s relative importance in our CPI model. The size of each word reflects its contribution magnitude to overall inflation predictions, helping subscribers quickly identify the most influential factors. The color coding further clarifies each indicator’s impact direction: blue words represent indicators with a disinflationary effect on CPI, while red words highlight inflationary factors. For instance, ‘Inflation Market Forecast’ is large, indicating their significant weight in the model, while its color suggests whether it contribute to higher or lower inflation trends. This Word Cloud enables a quick, visual analysis of the complex landscape of inflationary and disinflationary influences in our forecasting model.