
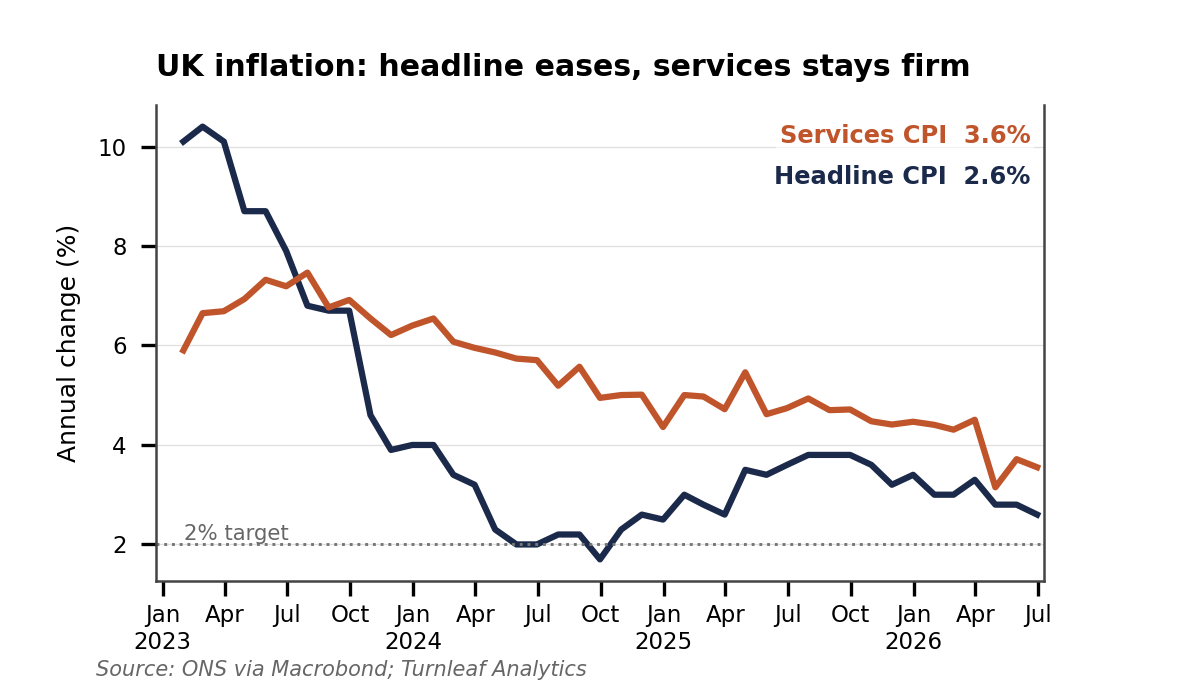
UK CPI printed at 2.6% YoY in June 2026, but the composition of that print sits uncomfortably against a broader policy package now working its way through the price level. Services inflation ran at 3.6% in the same month, a full percentage point above the headline rate, and that gap is the more informative number for the year ahead. The new government has announced three near-term cost-of-living measures. VAT will be removed from domestic electricity from October 2026, the bus-fare cap in England will fall to £2 from January 2027, and business rates in England will be cut by an additional 20% for eligible pubs, social clubs and live music venues from April 2027, on top of the 15% relief already in place for 2026/27 and with the largest live music venues excluded.
The first two measures act directly on measured CPI, alongside the freeze in regulated rail fares. The business-rates reduction does not, and we treat it in the same category as employment rights, immigration and planning, namely as a potential indirect influence on prices. All of it sits alongside deeper reforms across energy, fuel duty, wages and rented housing. Our reading is that the direct interventions are likely to be visibly disinflationary for measured CPI from late 2026, while the underlying picture is more mixed.
Services inflation remains sticky. Annual producer-price inflation also remains elevated, particularly in services, although monthly manufacturing-cost momentum softened in June, with input prices down 2.0% and output prices flat. The growing role of administered pricing means that simple read-through from wage growth or wholesale energy to CPI is no longer sufficient (Figure 1). Our 12-month forecast curve is currently tracking a widening gap between headline CPI shaped by policy dates and underlying inflation shaped by wages, margins, demand and capacity.
Figure 1. UK inflation, headline eases while services stays firm
Direct CPI effects
The clearest intervention is the removal of VAT from domestic electricity. Electricity accounts for roughly 2% of the CPI basket, and removing the 5% VAT rate could reduce the overall CPI price level by just under 0.1 percentage point under full pass-through. That is a one-off move in the price level which holds down the 12-month rate for roughly a year from October 2026 and then drops out of the annual comparison.
The measure follows a 13% increase in the typical dual-fuel price cap in July, although that increase was driven mainly by gas. Ofgem reports that electricity bills rose by around 5% and gas bills by around 24%, with the electricity unit rate moving from 24.67p to 26.11p per kWh. Removing VAT would lower VAT-inclusive electricity prices by approximately 4.8%, offsetting most of the July increase in the electricity component while leaving household gas prices untouched.
The same principle applies to transport. Regulated rail fares have been frozen, while the bus-fare cap will fall from £3 to £2 in January 2027. Both measures are disinflationary but their model contribution depends on the share of fares actually covered.
Fuel duty moves in the opposite direction, but later than previously planned. The temporary 5p-per-litre reduction has been extended until 31 December 2026. Under the current schedule, duty rates will begin returning towards their pre-March 2022 levels in January 2027, with a further increase in March, although final rates remain subject to confirmation at Budget 2026. The upward pressure on petrol and diesel prices therefore sits in 2027, and the size of the effect will depend on oil prices, refining margins and retailer pass-through. Our model treats each fare and duty change as an independent policy adjustment.
Labour
Labour reforms sit in the same category. The National Living Wage rose to £12.71 in April 2026, and new employment protections are being phased in across 2026 and 2027. These measures raise labour and compliance costs, particularly in hospitality, retail, care, cleaning and logistics. The inflation effect depends on whether firms absorb the increase through margins, improve productivity, reduce staffing, or pass costs into prices. Aggregate wage growth alone does not capture this, and regular pay growth has continued to ease even as services inflation has held near 3.6% (Figure 2). We track the wage-floor pass-through through the Average Weekly Earnings total-pay series on a three-month annual growth basis, and combine it with the Total Job Vacancies stock, the Online Job Adverts All Industries flow and the Labour Market Output Net Employment Balance to gauge the direction of sector-level pricing power. The Bank of England Realised and Expected Wage Growth series then anchor the forward path against firms’ own reported behaviour.
Figure 2
To read the rest of this article, please visit our latest Substack post, here.