
With September inflation data now arriving, we can compare the realised outcomes with forecasts made at the end of March, a few weeks into the conflict with Iran. Our forecasts had already moved higher with energy prices, providing an early view of where inflation could sit six months later.
Seven economies have reported so far. Across them, our end-March forecasts sit a median 0.40 percentage points from the September print. A similar ordering is visible in bond markets, where the countries we ranked higher for September inflation in March generally now sit at higher 10-year yields.
September is tracking our March path
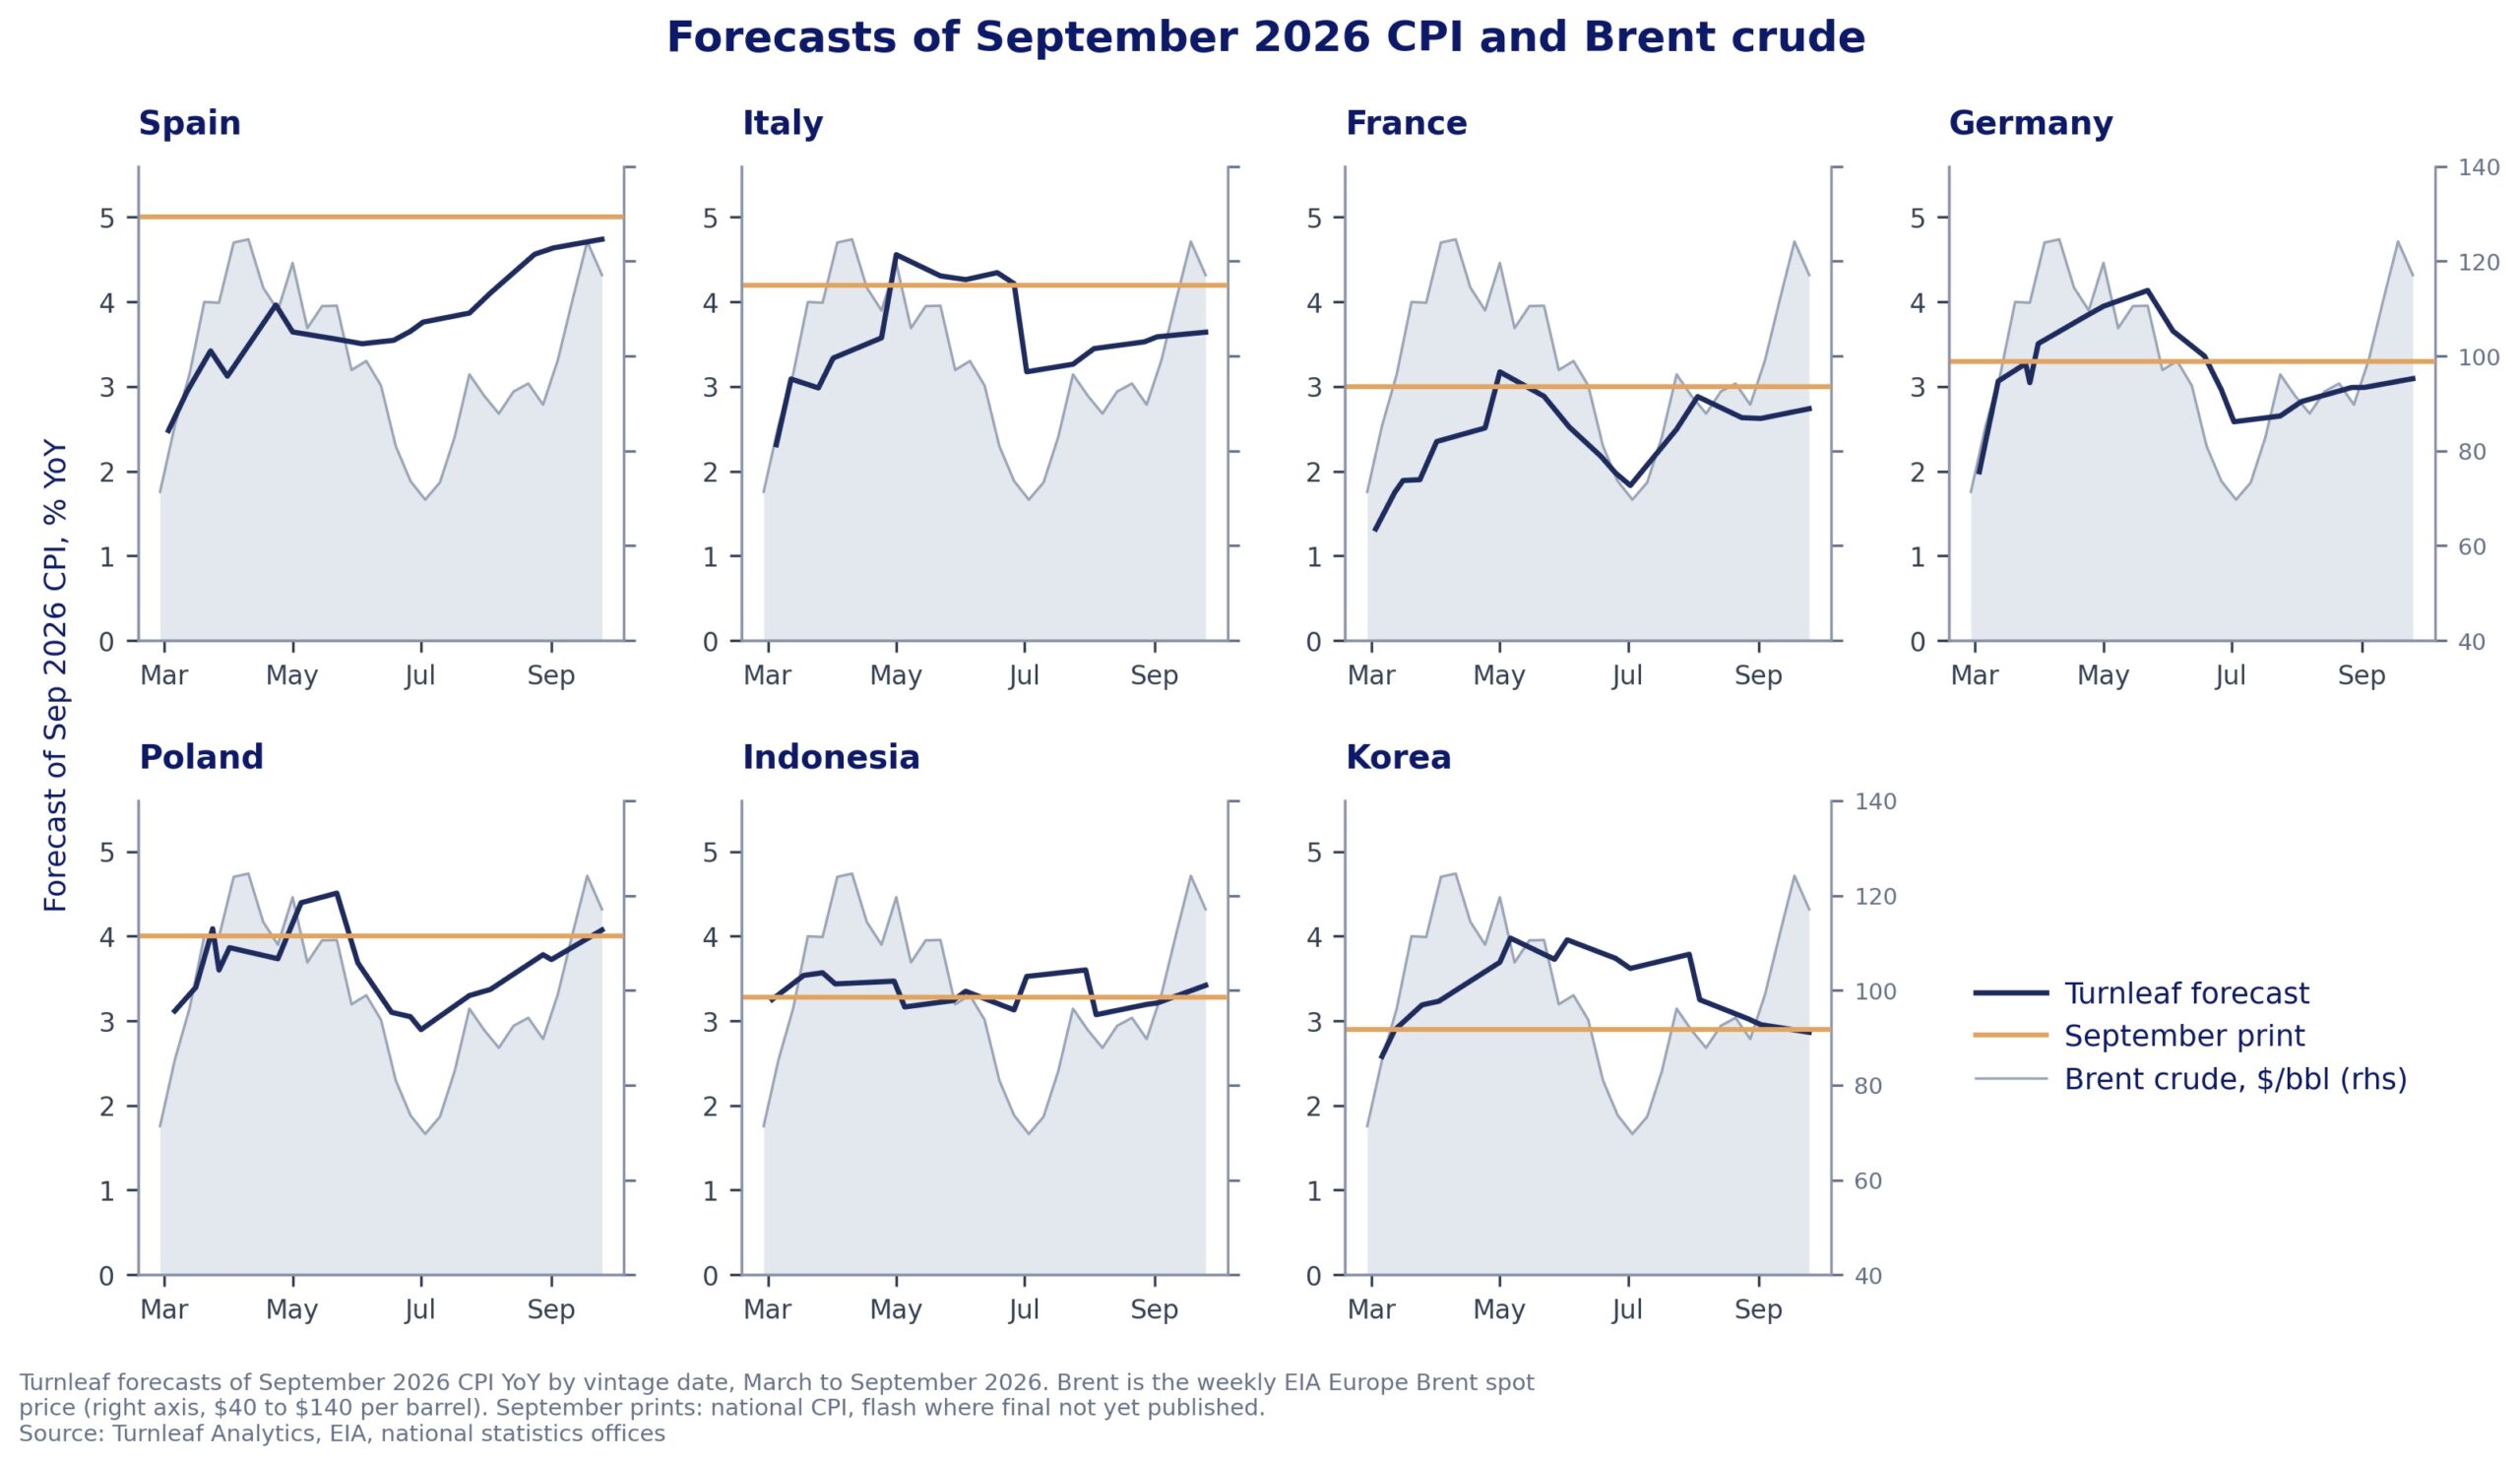
Figure 1 shows how our forecasts adjusted as the shock developed. They rose with Brent in the first weeks of the conflict, moved lower as oil retraced, then rose again as energy prices strengthened into September. Inflation in Spain, Italy and France ultimately came in above our March forecasts as the energy shock intensified again over the summer. In South Korea, a fuel price cap limited pass-through, and our forecast moved back towards the eventual print by September.
Figure 1. Turnleaf forecasts of September 2026 CPI by vintage date, March to September 2026, against the September print and Brent crude.
The rest of our coverage has yet to report September CPI. August provides an interim check, although it compares our September forecasts with an earlier inflation print. Across 31 economies excluding Turkey and Egypt, the median gap between our end-March September forecast and August inflation is 0.50 percentage points.
The inflation split is also visible in bond yields
The United States shows how inflation expectations and bond yields moved over the same period. At the end of March, we forecast September inflation at 3.72%, while market-implied pricing stood at 3.13%. By August, headline CPI had reached 3.4%. By 30 September, the market-implied estimate for September had risen to 3.66%, close to our latest nowcast of 3.69% and to the path we had forecast in March.
Bond yields repriced alongside that shift, although not uniformly. The US 10-year Treasury yield rose from 4.30% at the end of March to 5.17% on 25 September, while the 10-year Bund reached 3.62%. Yields moved less in Switzerland and Malaysia, while the Chinese 10-year yield fell.
Figure 2 puts that divergence in a cross-country context. Across a core sample of 25 markets, countries we expected in March to run hotter generally now sit at higher 10-year yields. The third-highest inflation market in our March ranking yields 3.3 percentage points more than the third-lowest. The comparison captures where yields had settled by late September, not how far each market had moved since March.
Figure 2. Turnleaf end-March 2026 forecast of September 2026 CPI YoY against 10-year government yields on 25 September 2026.
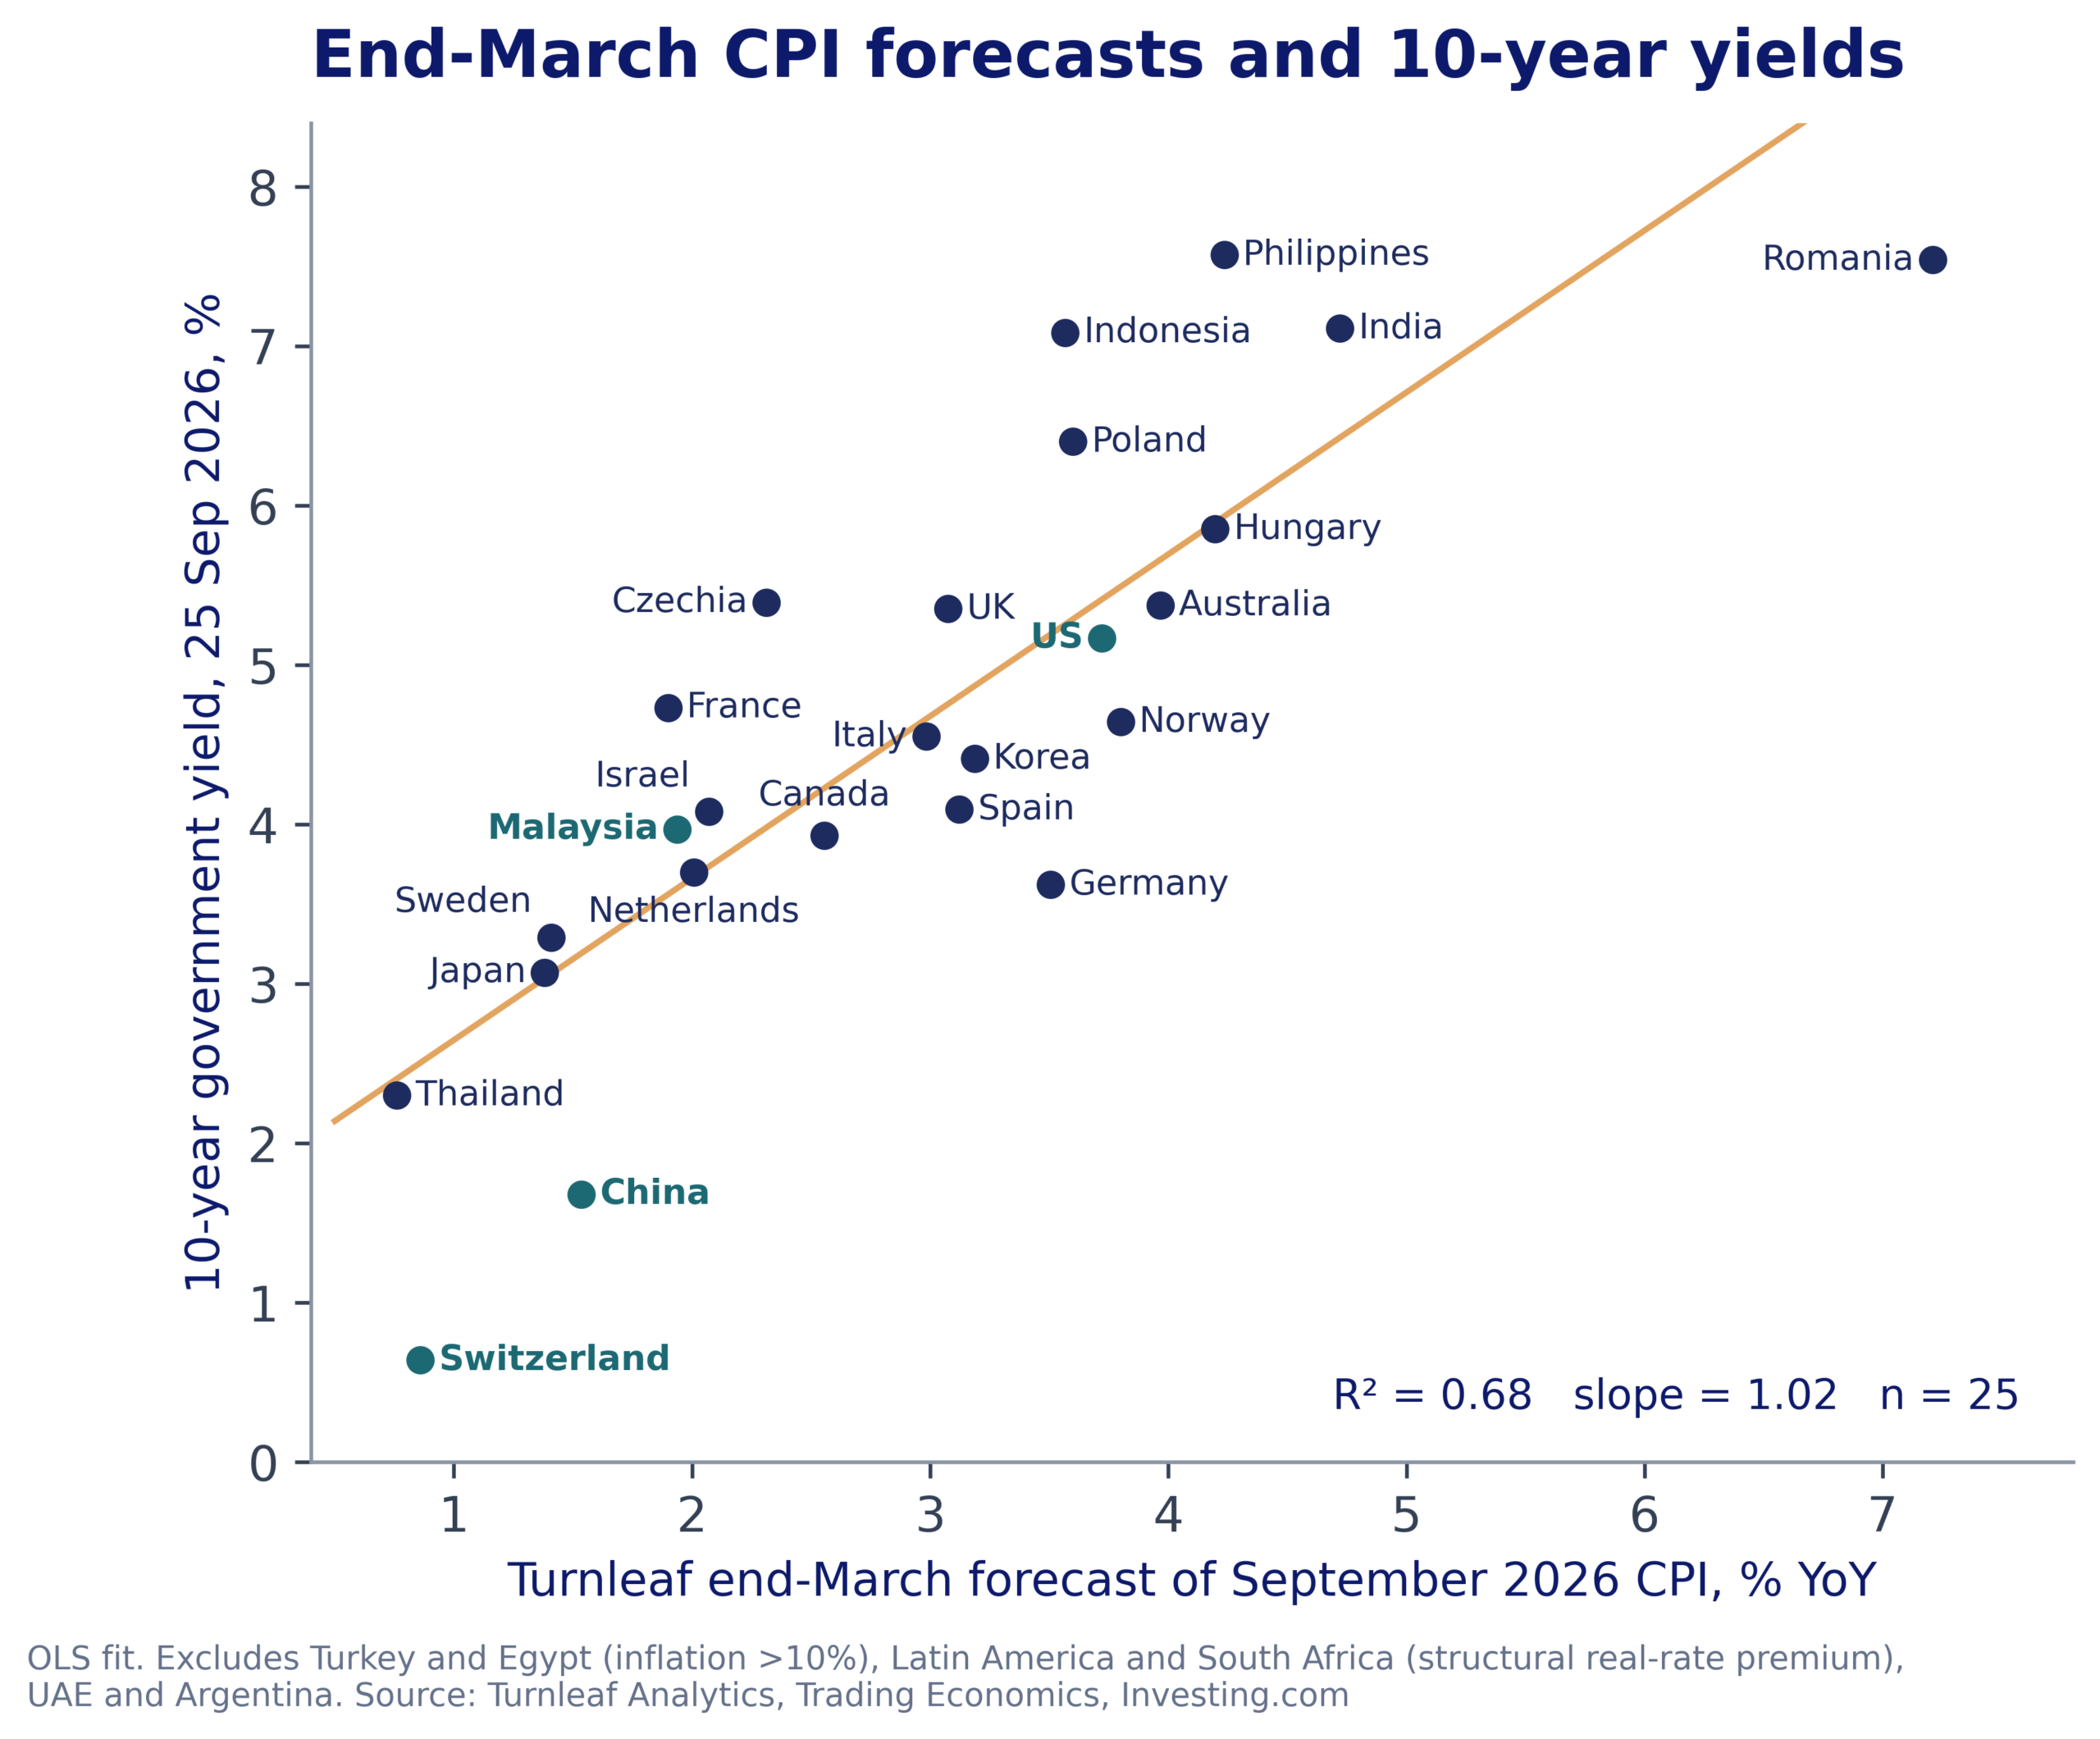
At the low-inflation end, Switzerland, China and Malaysia remain among the lower-yielding markets in the sample. The Swiss 10-year sits at 0.64%, China’s at 1.68% and Malaysia’s at 3.97%, below Indonesia and the Philippines. Inflation in all three has also remained relatively contained.
The US path from here
To read the rest, visit our latest Substack article, here.