
The new round of United States tariffs will not add materially to inflation. The 10% Section 122 surcharge lapses today, 24 July 2026, and the Office of the United States Trade Representative (USTR) is finalising a Section 301 forced labour action to replace it at 10% for fourteen economies and 12.5% for a further forty six. The rate rises two and a half points for the larger tier and falls to nothing for every trading partner outside the action, leaving the average effective rate close to its current 7.2%. We expect the tariff term to subtract from year on year core inflation over the next twelve months as the 2025 impulse rolls out of the base. The forecast risk now sits in crude, where Brent crossed $100 per barrel this week after Iran-aligned Houthi forces struck two Saudi tankers near Bab-el-Mandeb.
The Tariff Regime Reset
The Supreme Court struck down the tariffs imposed under the International Emergency Economic Powers Act (IEEPA) on 20 February 2026, forcing the administration onto Section 122 of the Trade Act of 1974 within days. The average effective tariff rate fell from 10.6% in January to 7.2% in May. Dispersion now matters more than the average, with steel and aluminium at 41.2%, Chinese goods at 23.4% and European Union origin goods at the 15% trade agreement ceiling since 1 July. The Section 232 duties carrying that dispersion were untouched by the litigation and have no sunset clause.
The successor is a labour standards measure. USTR found in June that most of the sixty countries in its Section 301 forced labour investigation had failed to impose and effectively enforce a prohibition on imports made with forced labour, setting 12.5% for those failing on both counts and 10% for the rest. Section 301 carries no statutory rate ceiling and no time limit, which is what Section 122 lacked.
The realised path settles the attribution. Headline CPI troughed at 2.4% YoY in January and February 2026, when the tariff burden was at its highest, and climbed to 4.2% in May after the effective rate had been cut by more than three percentage points (Figure 1). Energy inflation moved from 0.5% YoY in February to 23.5% in May. Core moved from 2.5% to 2.9% and has since returned to 2.6%.
Figure 1. US headline and core CPI, % YoY (upper), and the energy index, % YoY (lower), with the February 2026 tariff regime change marked. October 2025 was not published owing to the lapse in appropriations. Source: BLS.
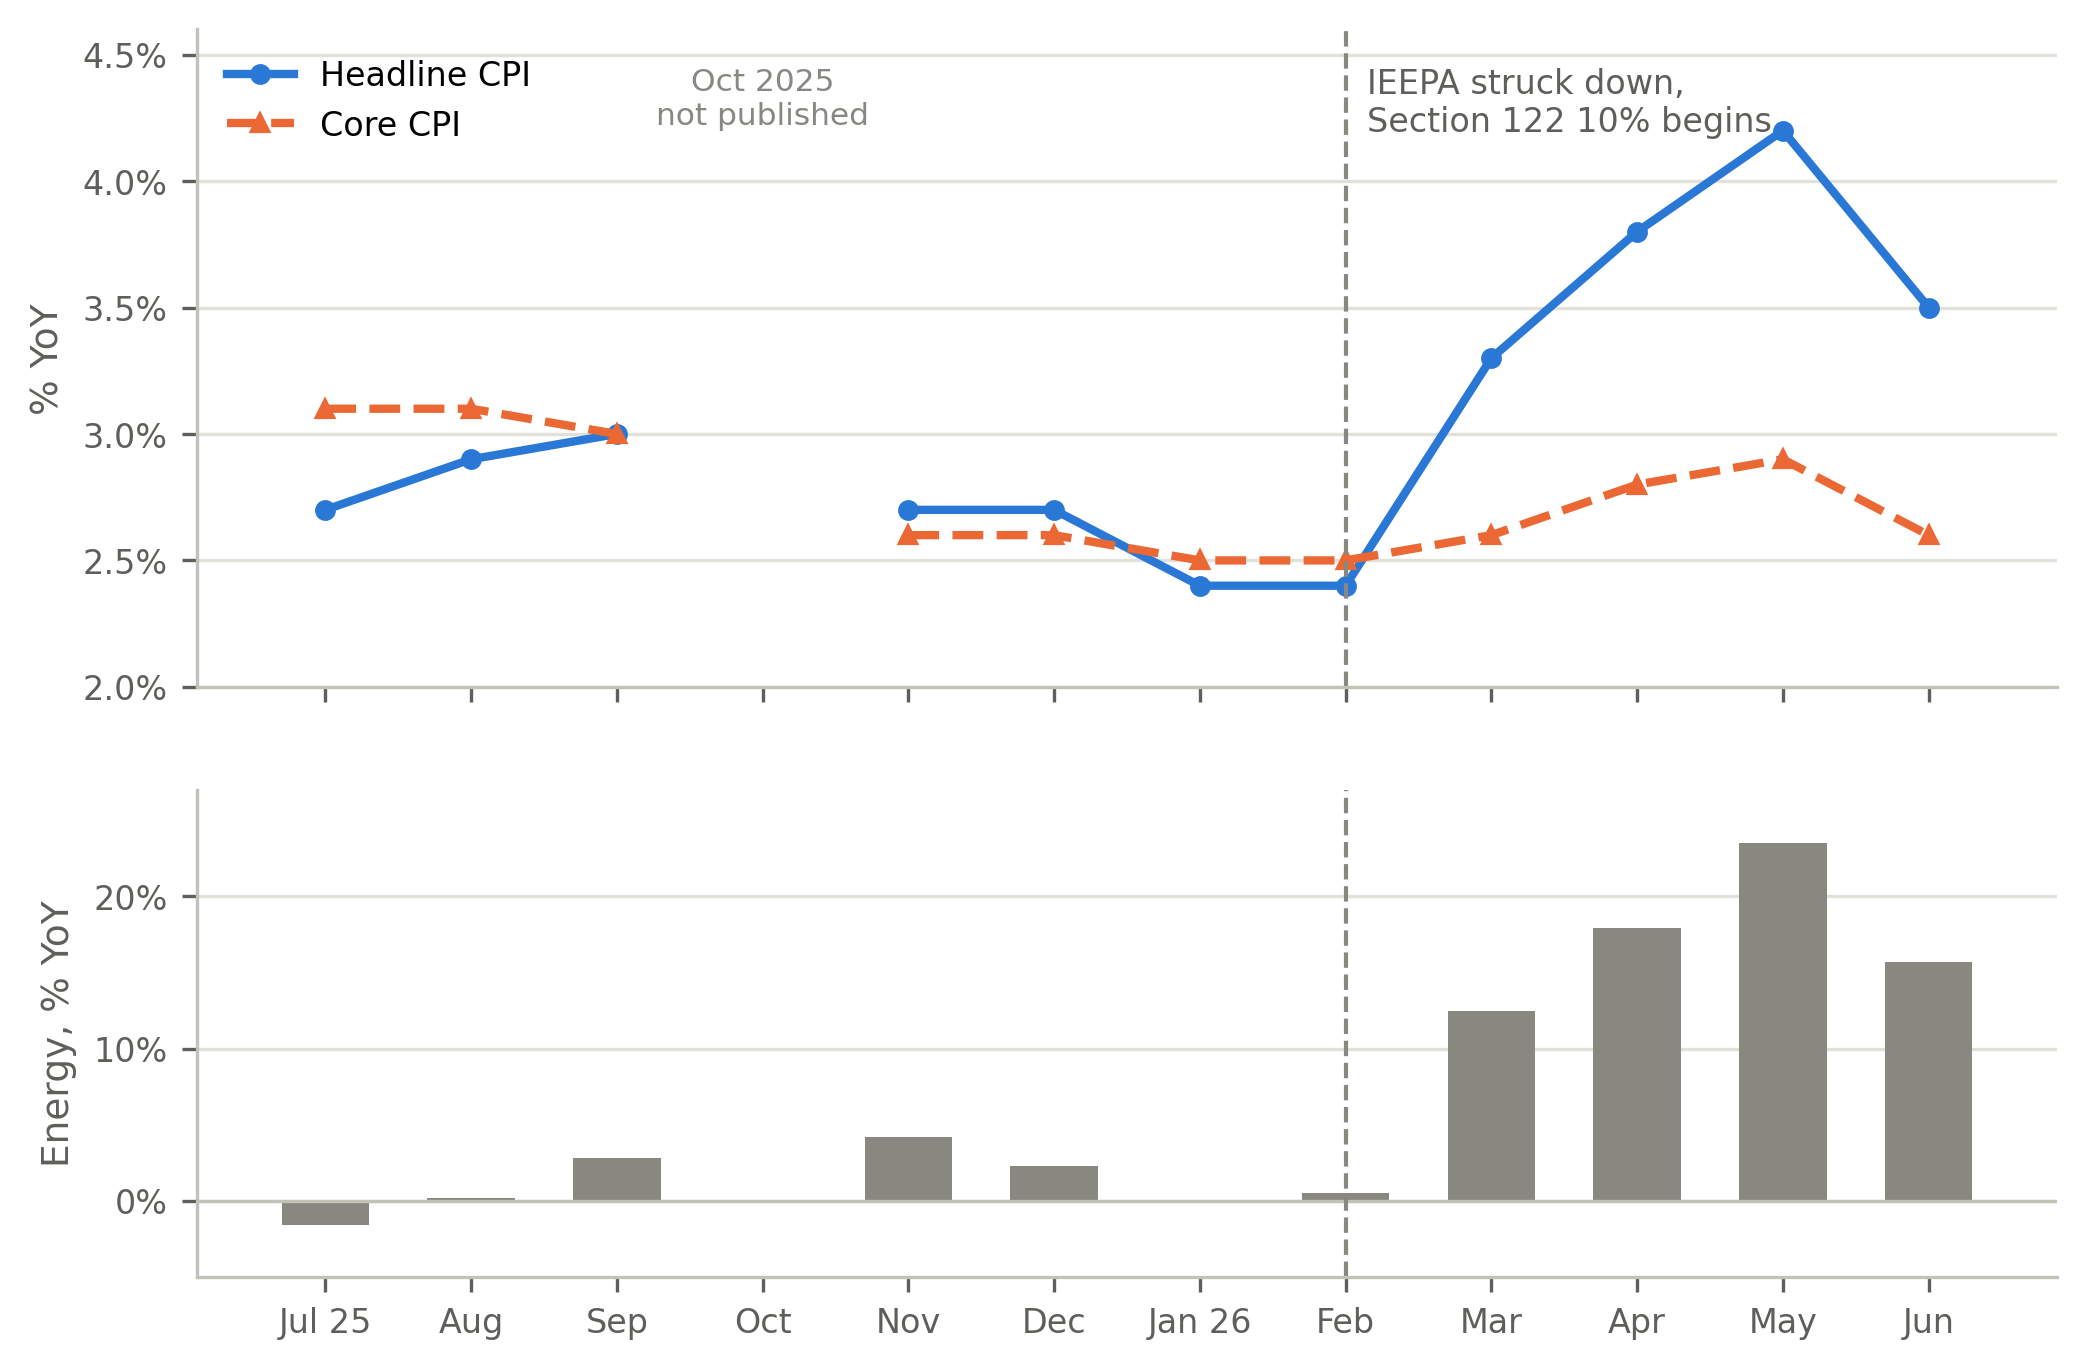
The June release confirmed the direction, with headline down 0.4% MoM to 3.5% YoY on a 5.7% fall in energy, core unchanged at 2.6% and core goods at 0.8% YoY, the slowest since June 2025. That relief has already reversed. Crude gave up its war premium during the 60-day ceasefire and traded below $72 in early July, and Brent has rallied more than 30% since as strikes on Iran continued.
Model Performance Through the Tariff Cycle
Our nowcasts tracked realised outturns closely through the September 2025 to February 2026 releases, when the 2025 tariff waves were passing through to shelf prices (Figure 2). Errors sat inside roughly a tenth of a percentage point in most of those windows. The December 2025 release is the clearest case, where our nowcast moved down towards the realised 2.7% while consensus held nearer 2.85%.
To read the rest of this article, take a look at our latest Substack post, here.