
Euro area annual inflation rose to 2.9% YoY in July 2026 from 2.8% in June, confirmed in Eurostat’s final release, driven by a renewed acceleration in energy inflation to 10.3% YoY from 8.5%. Turnleaf’s 18 August 2026 forecast suggests this pressure will continue to build, with headline inflation rising from around 3.4% YoY in August to a peak of roughly 4.2% in January 2027 (Figure 1). The composition of the energy shock is central to that outlook. Governments have so far cushioned the oil-price pass-through through fiscal measures. Gas prices, by contrast, have received far less policy protection and have risen roughly three times as much. Their impact is therefore likely to become more visible over the winter, after many of the measures shielding households from the oil shock have already expired, with the remainder set to roll off.
Figure 1
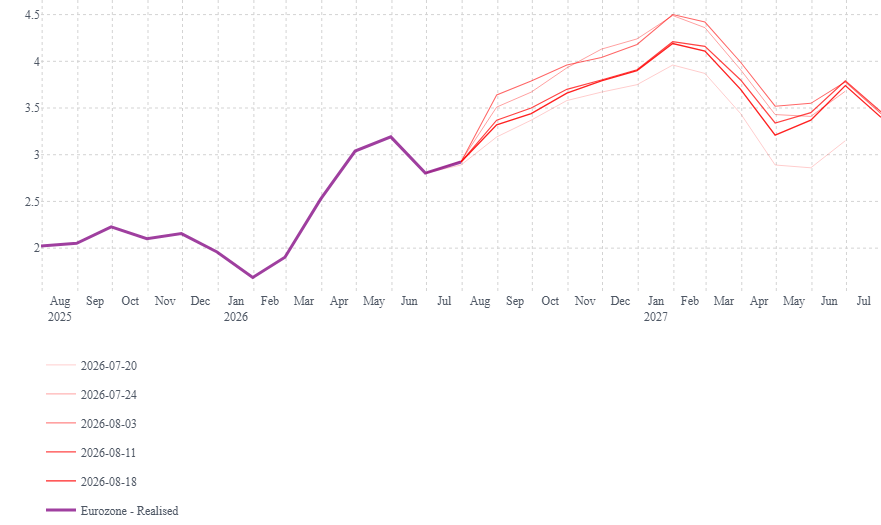
Euro area headline HICP, realised and successive Turnleaf forecast vintages, % YoY. Sources: Eurostat; Turnleaf Analytics.
Since the war in Iran began in late February 2026, ICE Brent 1st dated has risen around 28% from a pre-war close of USD 71.32 on 27 February, trading at USD 91.54 on 19 August and roughly 37% above a year earlier (Figure 2). Over the same window Dutch TTF front-month gas has gone from around EUR 32 per MWh in late February to EUR 62.20 on 18 August, close to double both its pre-war level and its level a year ago. Brent has already retraced most of its second-quarter peak, a quarter for which the June Eurosystem staff projections carried an oil assumption of around USD 112 per barrel. Gas has done the opposite and has kept grinding higher through the summer injection season.
Figure 2
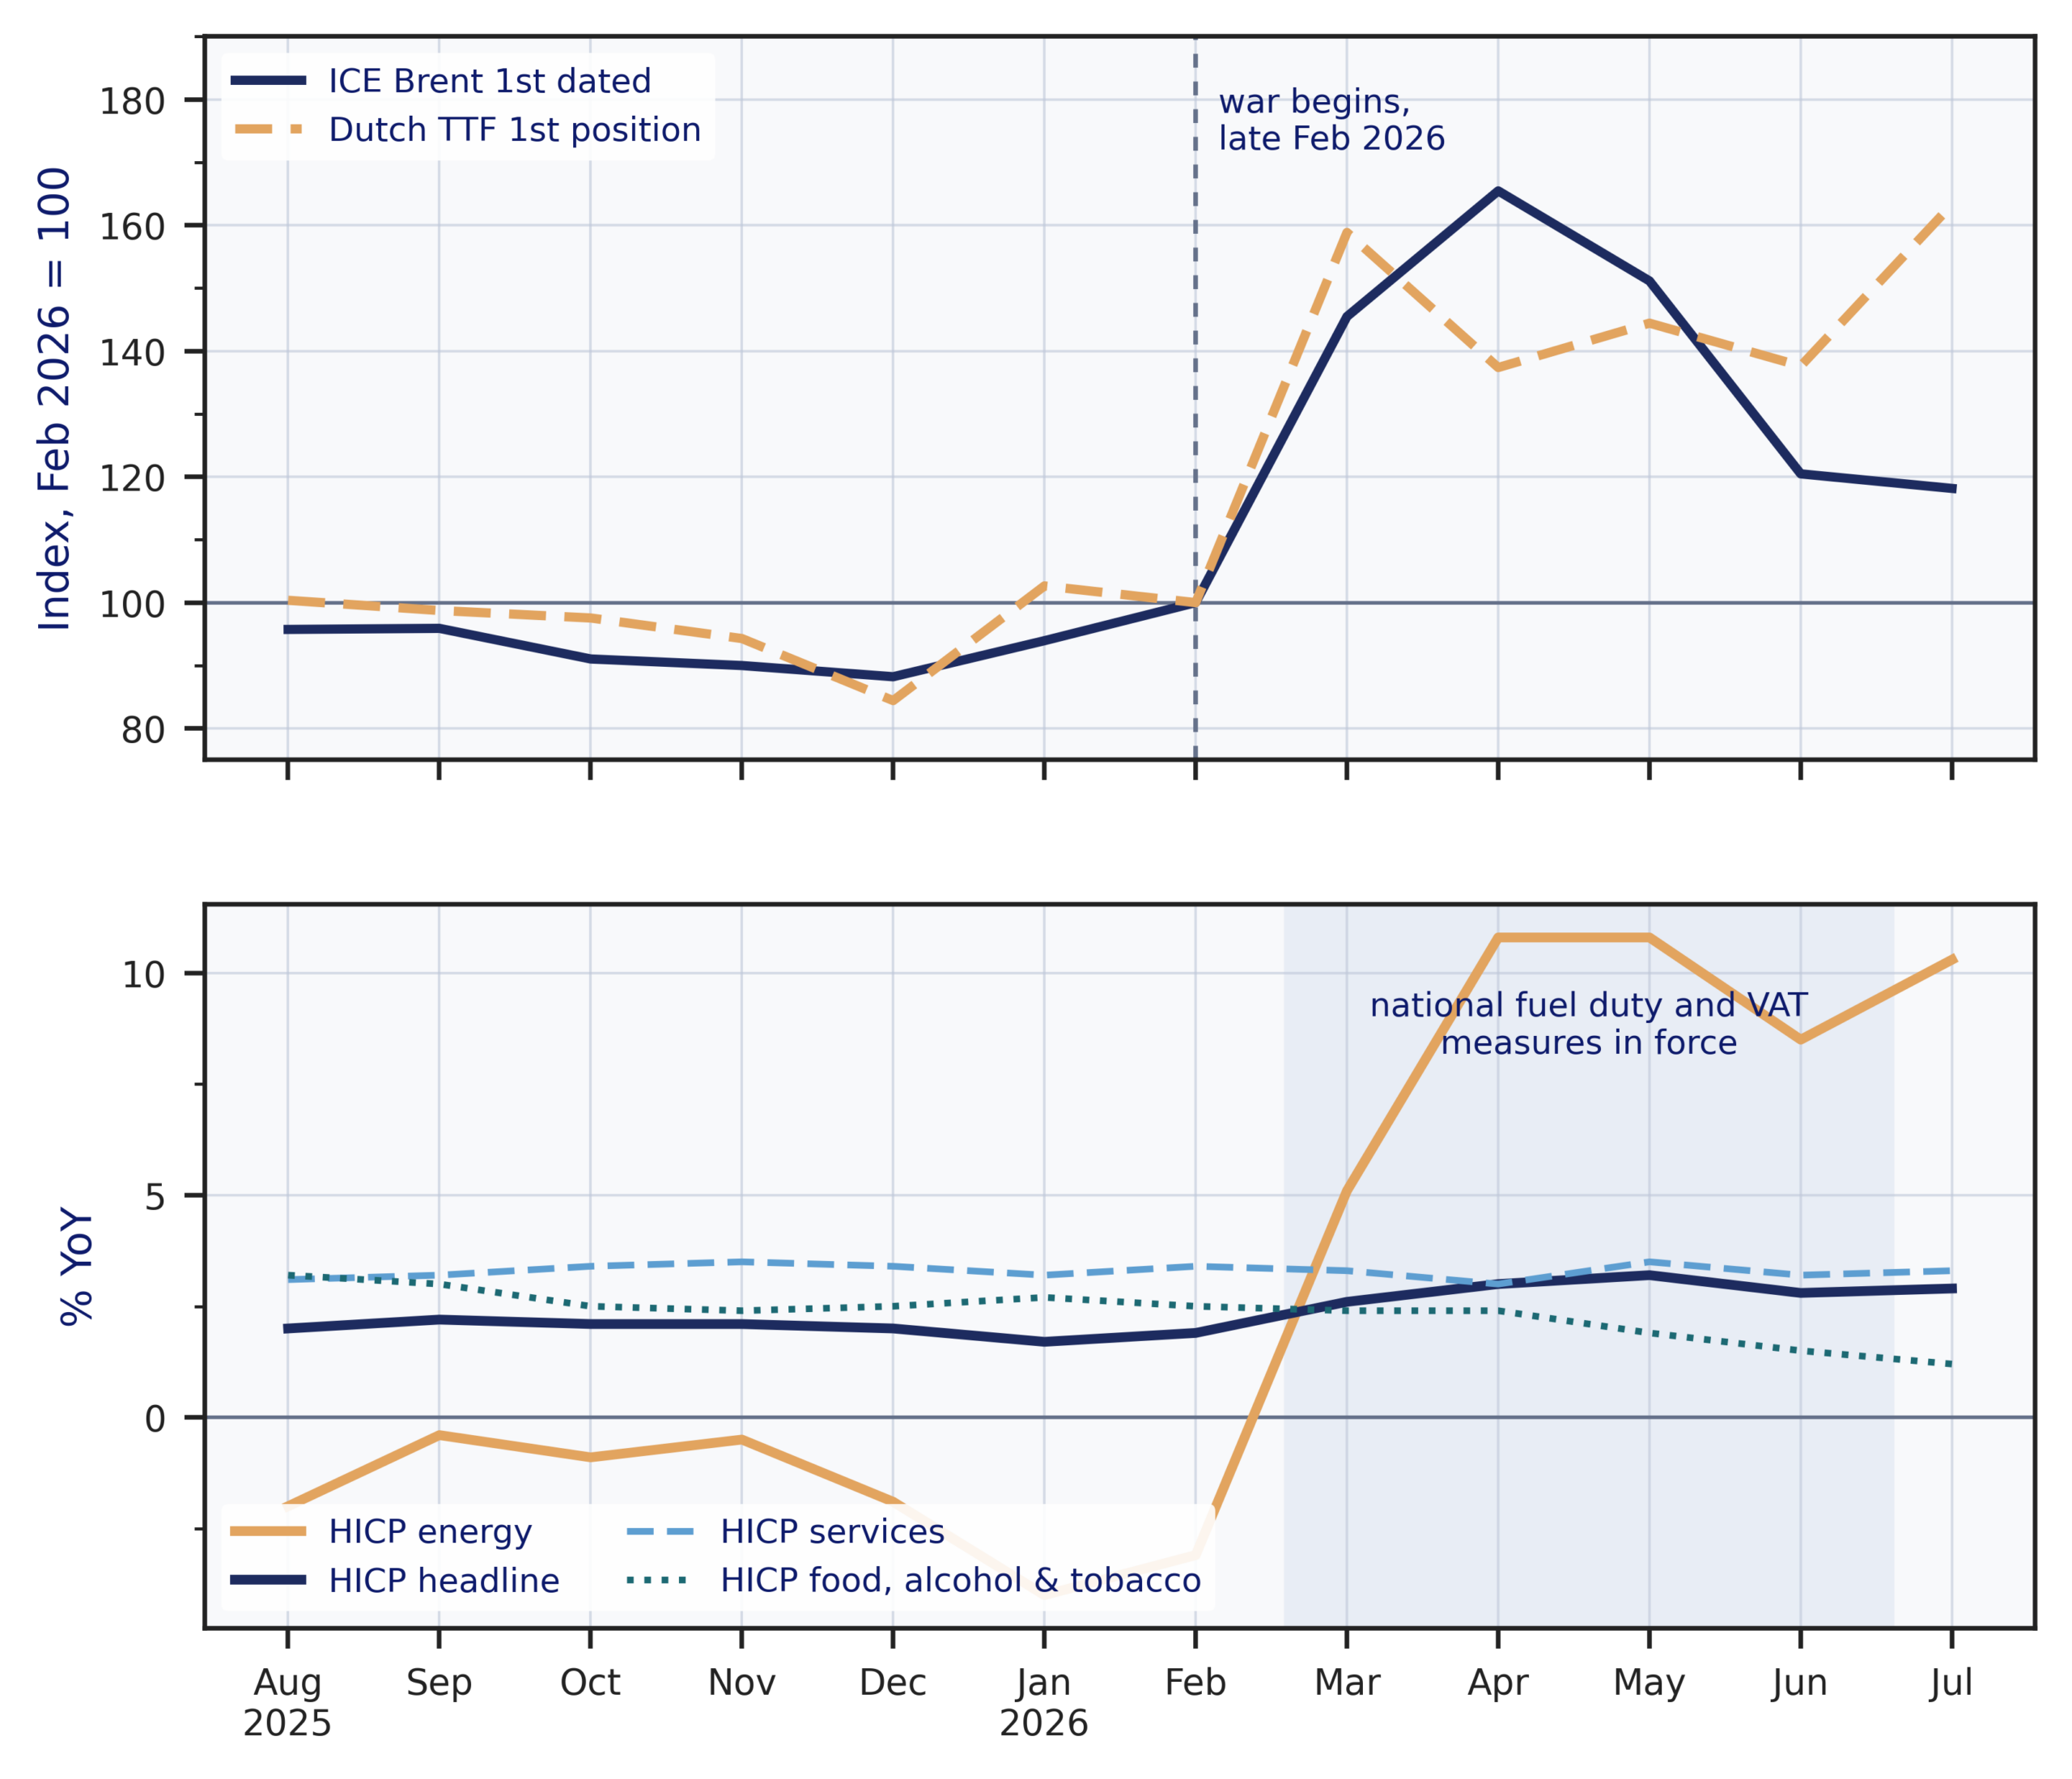
Top, Brent spot price and Dutch TTF front-month, monthly averages, rebased to February 2026, the month the conflict began. Bottom, euro area HICP annual rates by component, with the window in which national fuel duty and VAT measures were in force. Sources: Eurostat; EIA; Bruegel; EEX and ICIS.
The oil leg is also the one governments chose to intervene in. Bruegel’s tracker puts the European fiscal response at EUR 11.8 billion, with the largest single share in fuel excise cuts and VAT reductions on motor fuels and electricity, and more than half of the total untargeted (Figure 3). Spain committed EUR 4.7 billion, including a EUR 2.6 billion VAT reduction on fossil fuels and electricity running from 21 March to 30 June. Germany’s EUR 1.6 billion energy tax cut ran through May and June, Italy’s motor fuel excise cut from March to May, and Ireland’s excise phases into July. Germany, Italy and France had let their measures lapse by the end of the second quarter, but Ireland’s ran into July and Spain, the largest programme at roughly 40% of the European total, tapered its fuel discount through the summer rather than ending it. Part of the jump in euro area energy inflation from 8.5% in June to 10.3% in July is therefore the withdrawal of the cushion. The clearest evidence is the German July release, where motor fuels rose 23.0% YoY because the fuel discount ended on 30 June while household energy actually fell 1.4% on the relief measures that remained. Spain cut its diesel rebate from 15 cents per litre in July to 10 cents in August as that taper ran on, then raised it to 20 cents in September under a safeguard clause triggered when diesel passed 15% YoY.
Figure 3
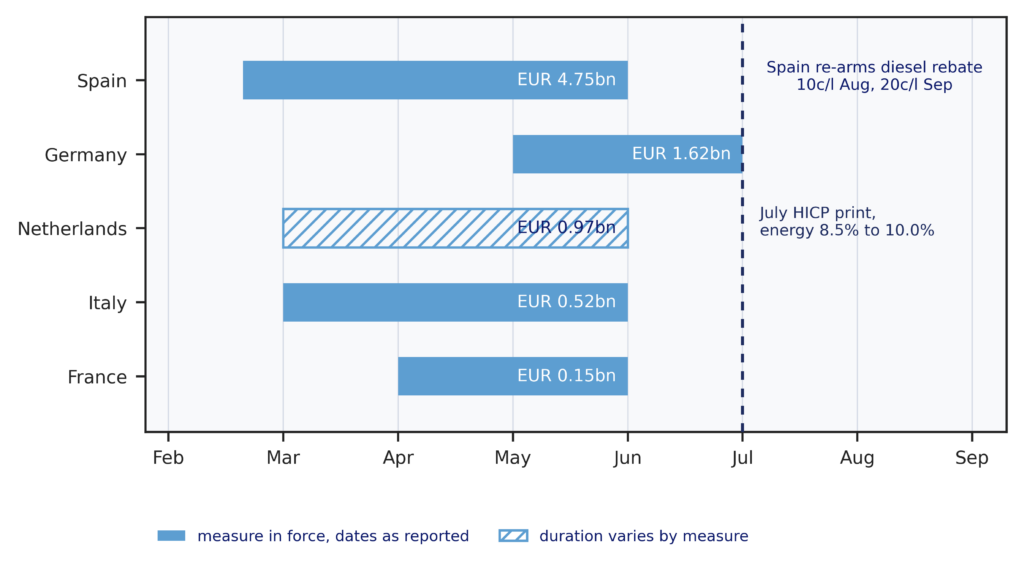
National energy price measures in force during 2026, selected member states, with committed amounts. Source: Bruegel 2026 European energy crisis fiscal response tracker. Dates as reported; the EU-wide total across all member states is EUR 11.8 billion.
Gas has no equivalent programme at anything like that scale, and Europe’s exposure runs through price rather than through volume. More than 10 billion cubic feet per day of LNG, roughly 20% of world trade, transits the Strait of Hormuz, most of it Qatari, and QatarEnergy has been under force majeure since late March, since extended into October. Qatari gas is under 4% of total EU gas imports, so the direct loss is small. The problem is that Asian buyers take more than 80% of Qatari volumes and are now bidding for the same Atlantic basin spot cargoes Europe needs. In the weeks after the closure JKM rose 51% and TTF 35%, while Henry Hub fell 9%. Europe is a price-taker in a market it barely depends on physically.
That matters more than usual this year because the buffer is thin. EU storage stood at 28% full on 1 April 2026, the lowest in four years, and had reached only around 49% by early July. It passed 60% on 13 August and stood at roughly 61% in mid-August, still the lowest for the date in five years (Figure 4). The legal target is 90% by 1 November, with 80% recommended in difficult conditions and derogations down to 70%. Reaching 90% would require LNG imports around 13% above 2025 levels into a market where Asia holds the marginal bid. This is the part of the shock that no fiscal package currently covers, and it lands squarely in the months our forecast peaks.
Gas reaches the consumer mainly through electricity, and this is where the generation mix does real work. On the European Commission’s analysis, renewables reached roughly 45% of EU generation by 2025, and the share of hours in which fossil fuels set the electricity price has fallen from around 70% in 2020 to roughly 50% in 2025. The dispersion inside that average is what drives our country paths. On the Commission’s estimate for 2026 to date gas sets the power price in around 15% of hours in Spain and Portugal against roughly 90% of hours in Italy. In March 2026 Spanish wholesale power averaged EUR 42 per MWh while Italian wholesale power averaged EUR 143. The same gas price produces very different consumer electricity inflation depending on where it lands. The ECB made a version of this point in June, noting that electricity has responded far more modestly than in 2022 and crediting the cushioning role of renewable generation.
Figure 4
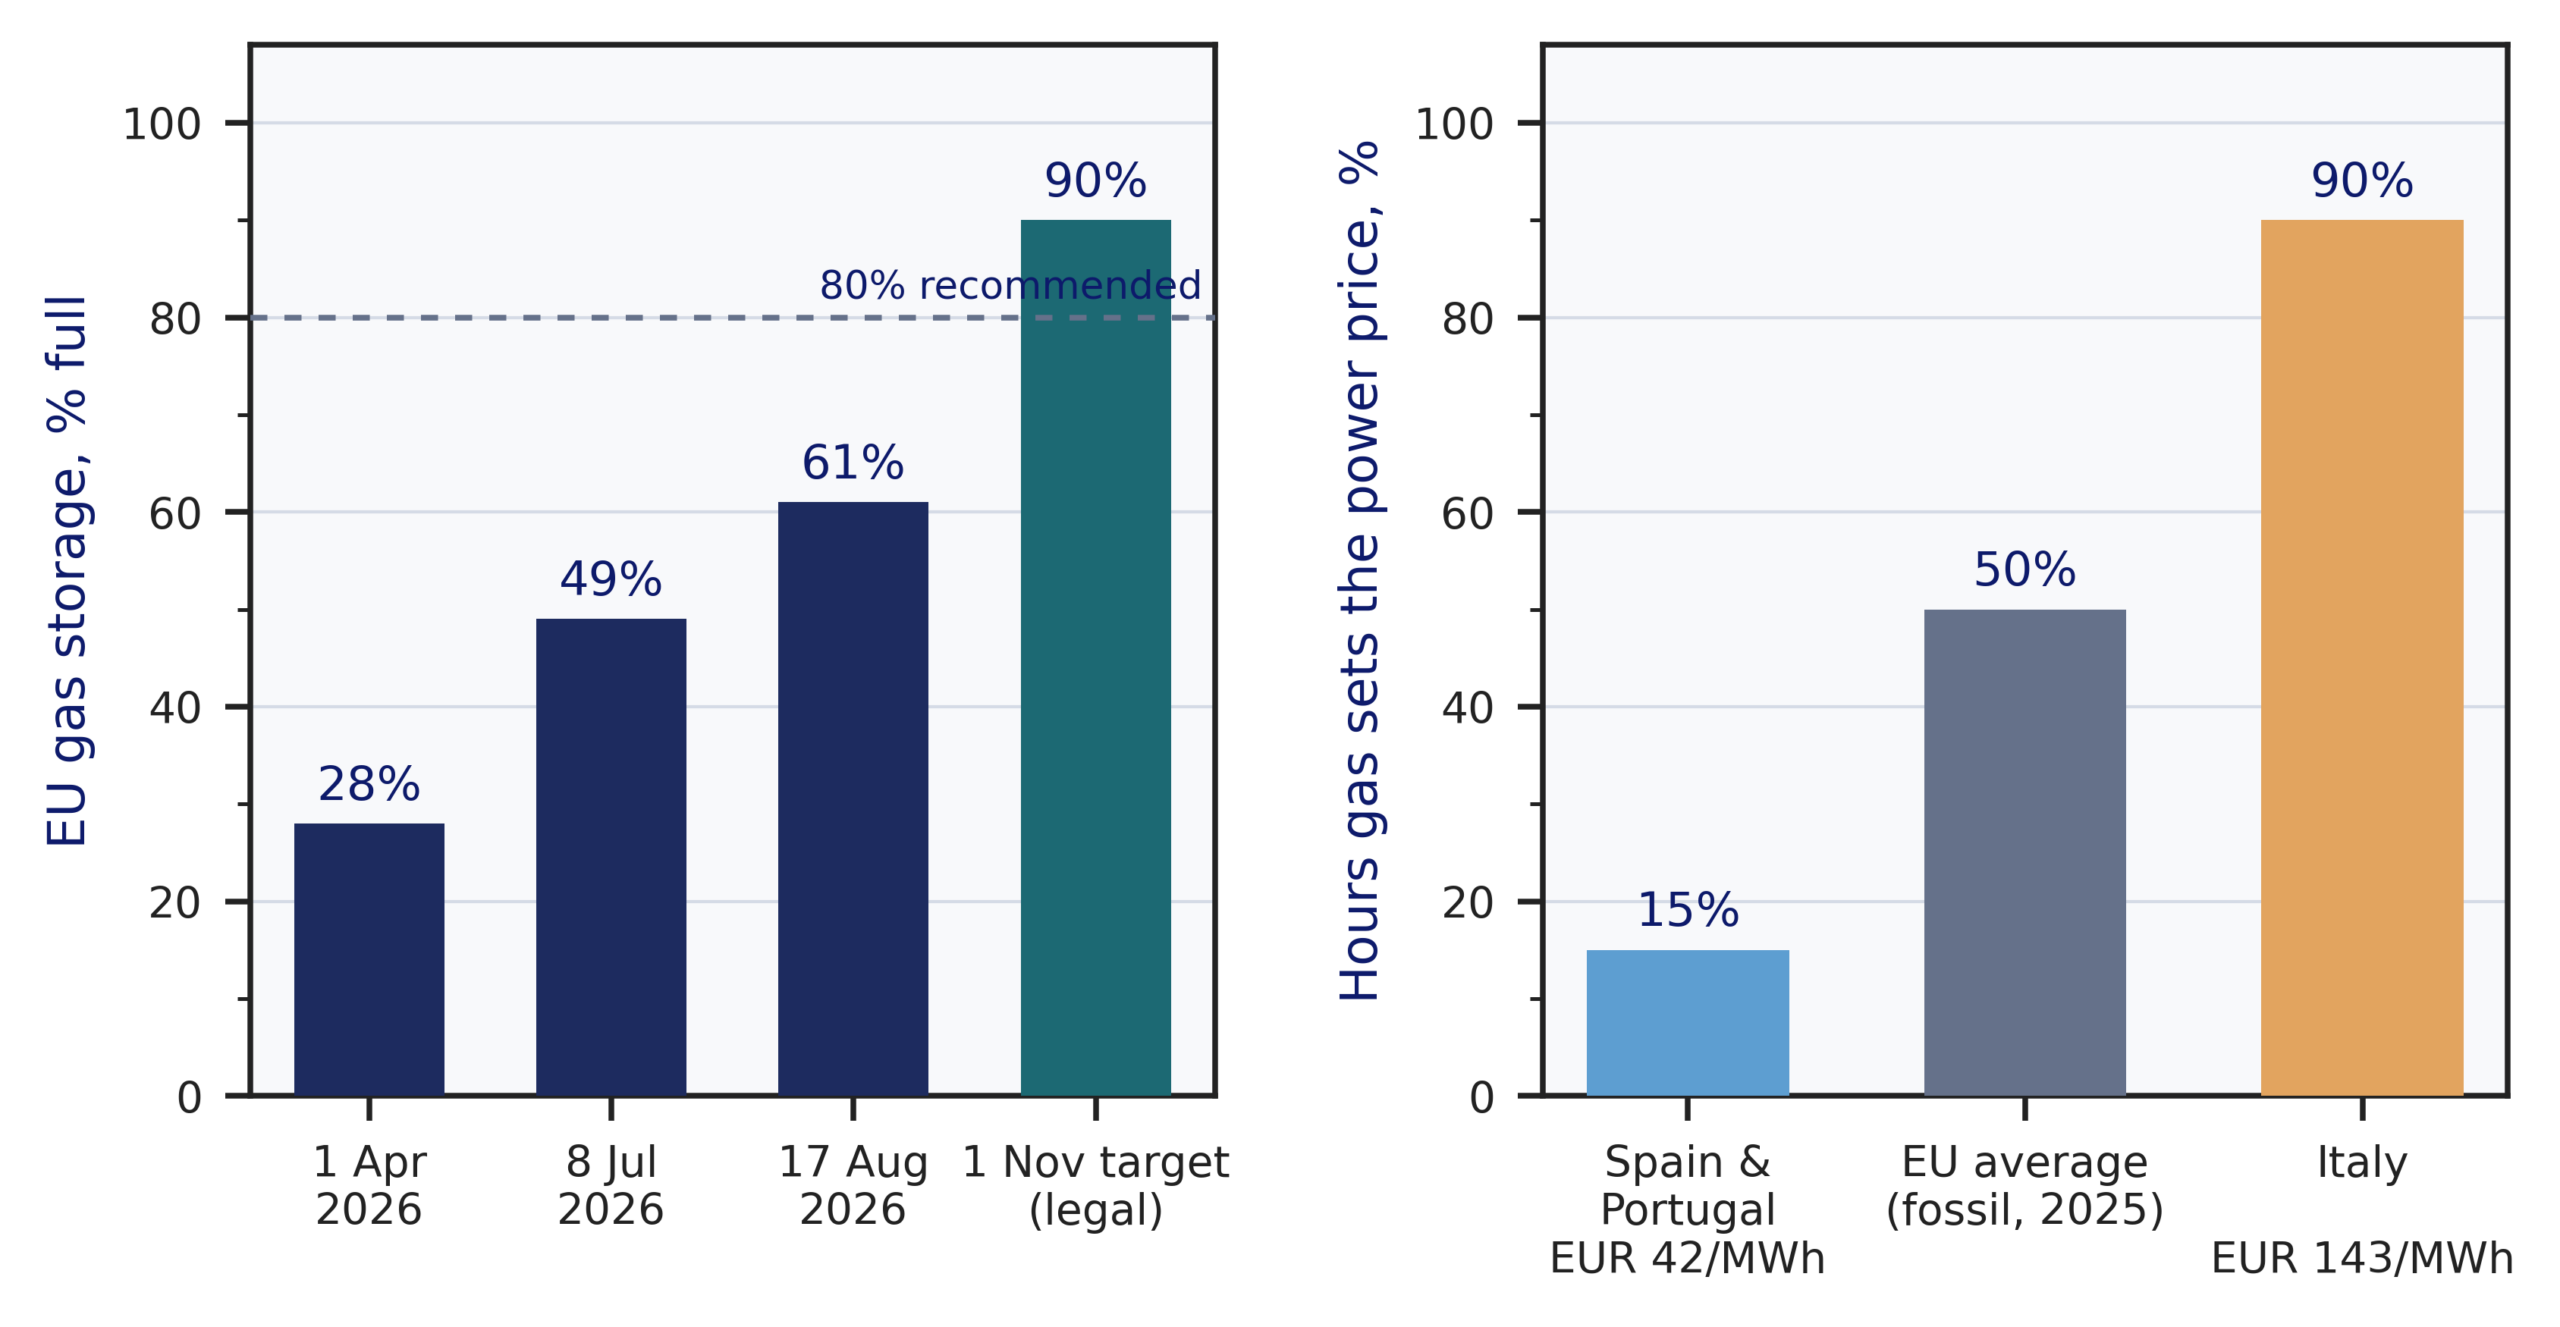
Left, EU gas storage fill through 2026 against the 1 November statutory target. Right, share of hours in which gas sets the wholesale electricity price, with March 2026 wholesale power prices. Sources: European Commission; Euronews and ACER; EIA.
Our contribution decomposition for the euro area is consistent with this reading. The largest traded-energy contributor is the ICE Dutch TTF gas first position moving average, ahead of Brent 1st dated, with market-implied euro area CPI excluding tobacco alongside them. At country level the mix rotates. Italy is led by crude and refined products, France carries large oil contributions alongside food, Spain is led by power-specific series, and Germany carries both. The presence of the market-implied series tells us the model is reading how the shock is being priced forward, which is why our curve responds to Hormuz negotiation headlines and not only to the monthly prints.
Turnleaf expects euro area inflation to keep rising through the winter, peaking at roughly 4.2% YoY in January 2027 before falling back towards roughly 3.2% by April 2027 and settling near 3.4% by July. The shape is a base effect as much as a level effect. Euro area energy inflation was negative in every month from November 2025 to February 2026 and reached minus 4.0% YoY in January 2026, so even a flat euro-denominated energy complex lifts the annual rate into January and drops it once the base flips in March. Our 18 August vintage sits roughly 0.3 percentage points below our 3 August vintage at the peak, consistent with Brent retracing while gas has not.
Energy carries a weight of 9.0% in the 2026 euro area HICP basket, so a 10.3% YoY energy rate accounts for roughly 0.9 percentage points of the 2.9% headline. The rest of the basket is not yet carrying the shock. Services, at 46.8% of the basket, are at 3.3% and have held between 3.0% and 3.5% for a full year. Non-energy industrial goods, at 25.2%, are at 0.9%. Food, alcohol and tobacco, at 18.9%, have decelerated from 3.2% in August 2025 to 1.2% in July 2026. On this evidence the euro area still has a large relative price shock.
Country Dispersion
The country charts below show how inflation differences across member states reflect two factors: the extent to which national electricity prices are exposed to gas and the timing of each country’s fiscal support and administered-price adjustments. The euro area path above is our 18 August vintage. The country paths below are our 3 August vintage, which is the latest available for each national model.
Germany
German national CPI printed 2.8% YoY in July 2026, from 2.3% in June, but the next leg of inflation will depend increasingly on how the energy shock feeds through after the summer. Motor fuels jumped 23.0% YoY as the government fuel discount expired on 30 June, while household energy still fell 1.4% under the relief measures that remained in place. Core inflation was comparatively contained at 2.4% and food inflation at just 0.4%. Our 3 August forecast therefore keeps Germany in a roughly 2.5% to 3.5% inflation corridor through mid-2027, with the main upside risk shifting from fuels toward gas and broader energy costs as existing support rolls off. Germany sits close to the EU average in the extent to which gas sets electricity prices, but its large reliance on imported gas leaves it exposed to renewed TTF pressure. This is why our decomposition gives a prominent role to Dutch TTF gas prices, alongside Brent, U.S. jet fuel prices and firms’ selling-price expectations, as indicators of where inflation is likely to move next.
To gain access to Turnleaf’s 12-month inflation forecasts for Germany, France, Spain, Italy, and Netherlands, visit our latest Substack post, here.