
Six months after Iran began blocking the Strait of Hormuz on 28 February 2026, the cost of many of the inputs that feed into food production has risen sharply, yet consumer food prices have barely responded. Urea, a key input for fertilisers, passed $850 a tonne in April, an 80% rise in two months and the highest level since April 2022, on World Bank data. The FAO Food Price Index stood at 133.3 points in August, up 1.9% on the month and 2.5% on the year, and still 16.8% below its March 2022 peak. In this article, Turnleaf unpacks the gap between input costs and final food prices to assess whether the shock will eventually reach consumers and, ultimately, push inflation higher.
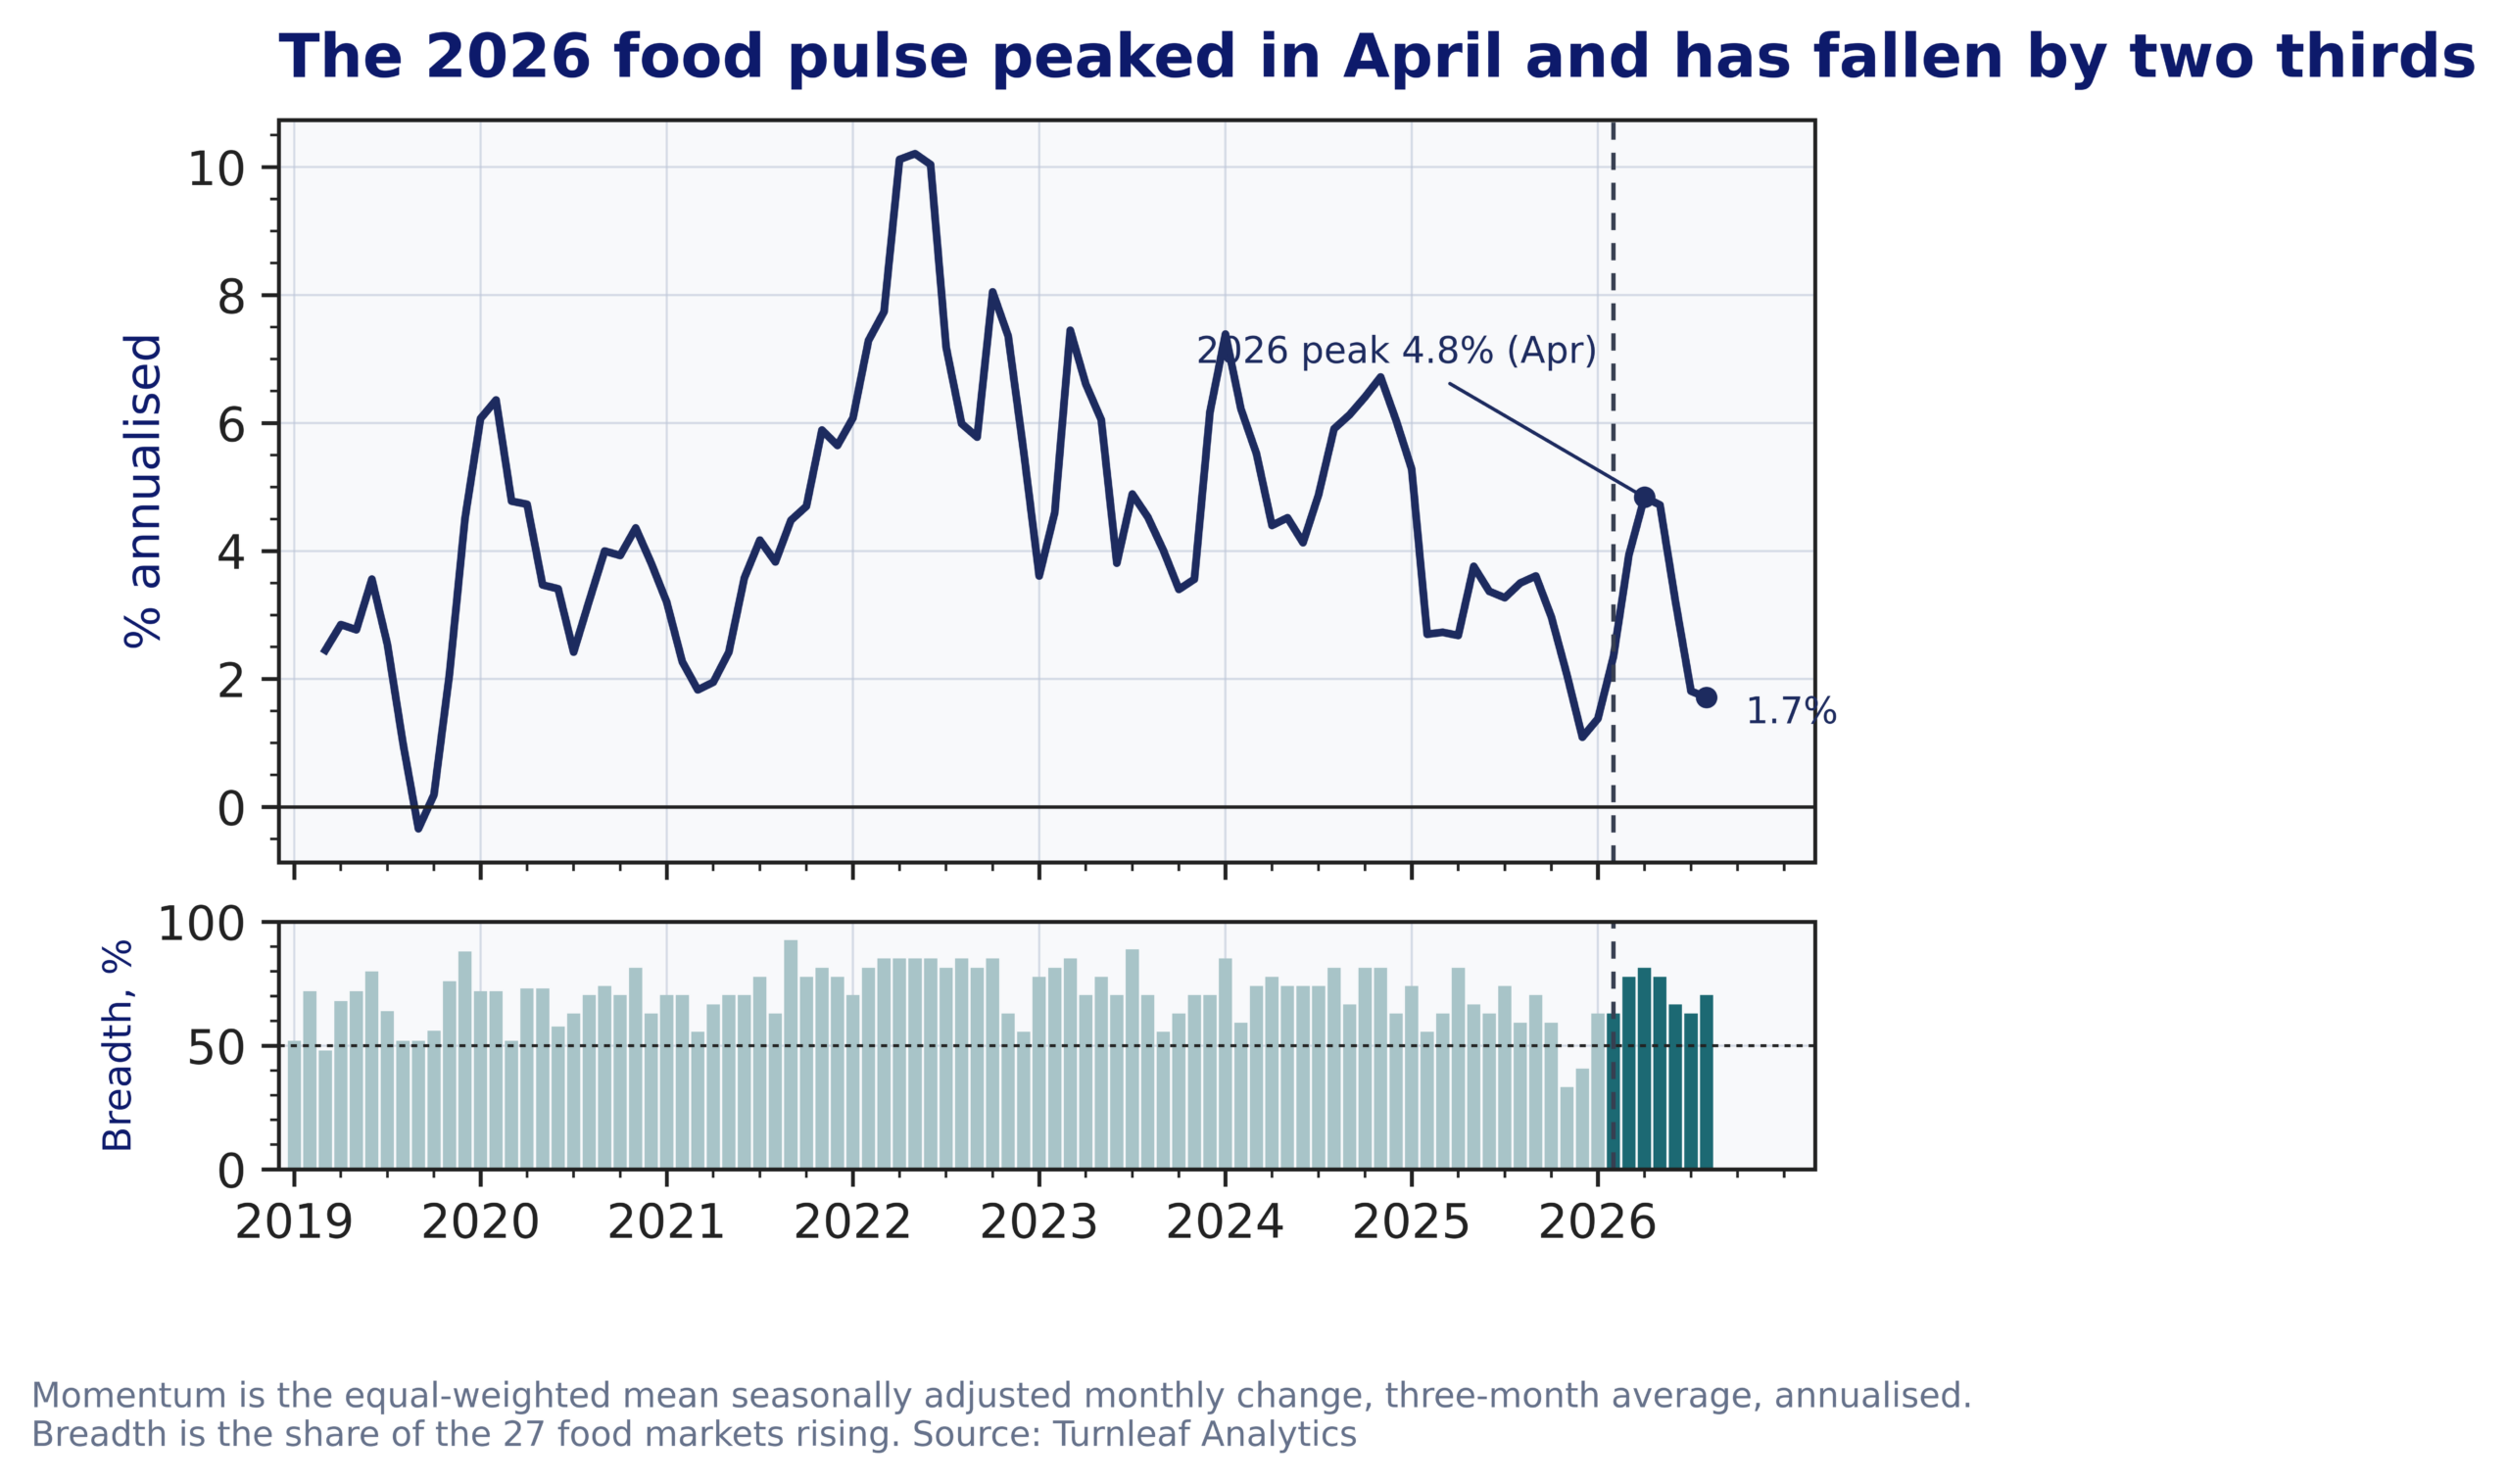
Our alternative-data indices show the same split at the consumer level. The fuel panel covers 35 markets and the food panel 27, and both run through 31 August 2026. Median retail fuel inflation swung from minus 4.4% year on year in February to 14.3% in August, while median food inflation moved only from 1.5% to 2.1%. Seasonally adjusted food momentum did pick up, peaking at 4.8% annualised in April, but it fell by two thirds to 1.7% by August.
Figure 1. Median year-on-year change in Turnleaf retail fuel and food indices.
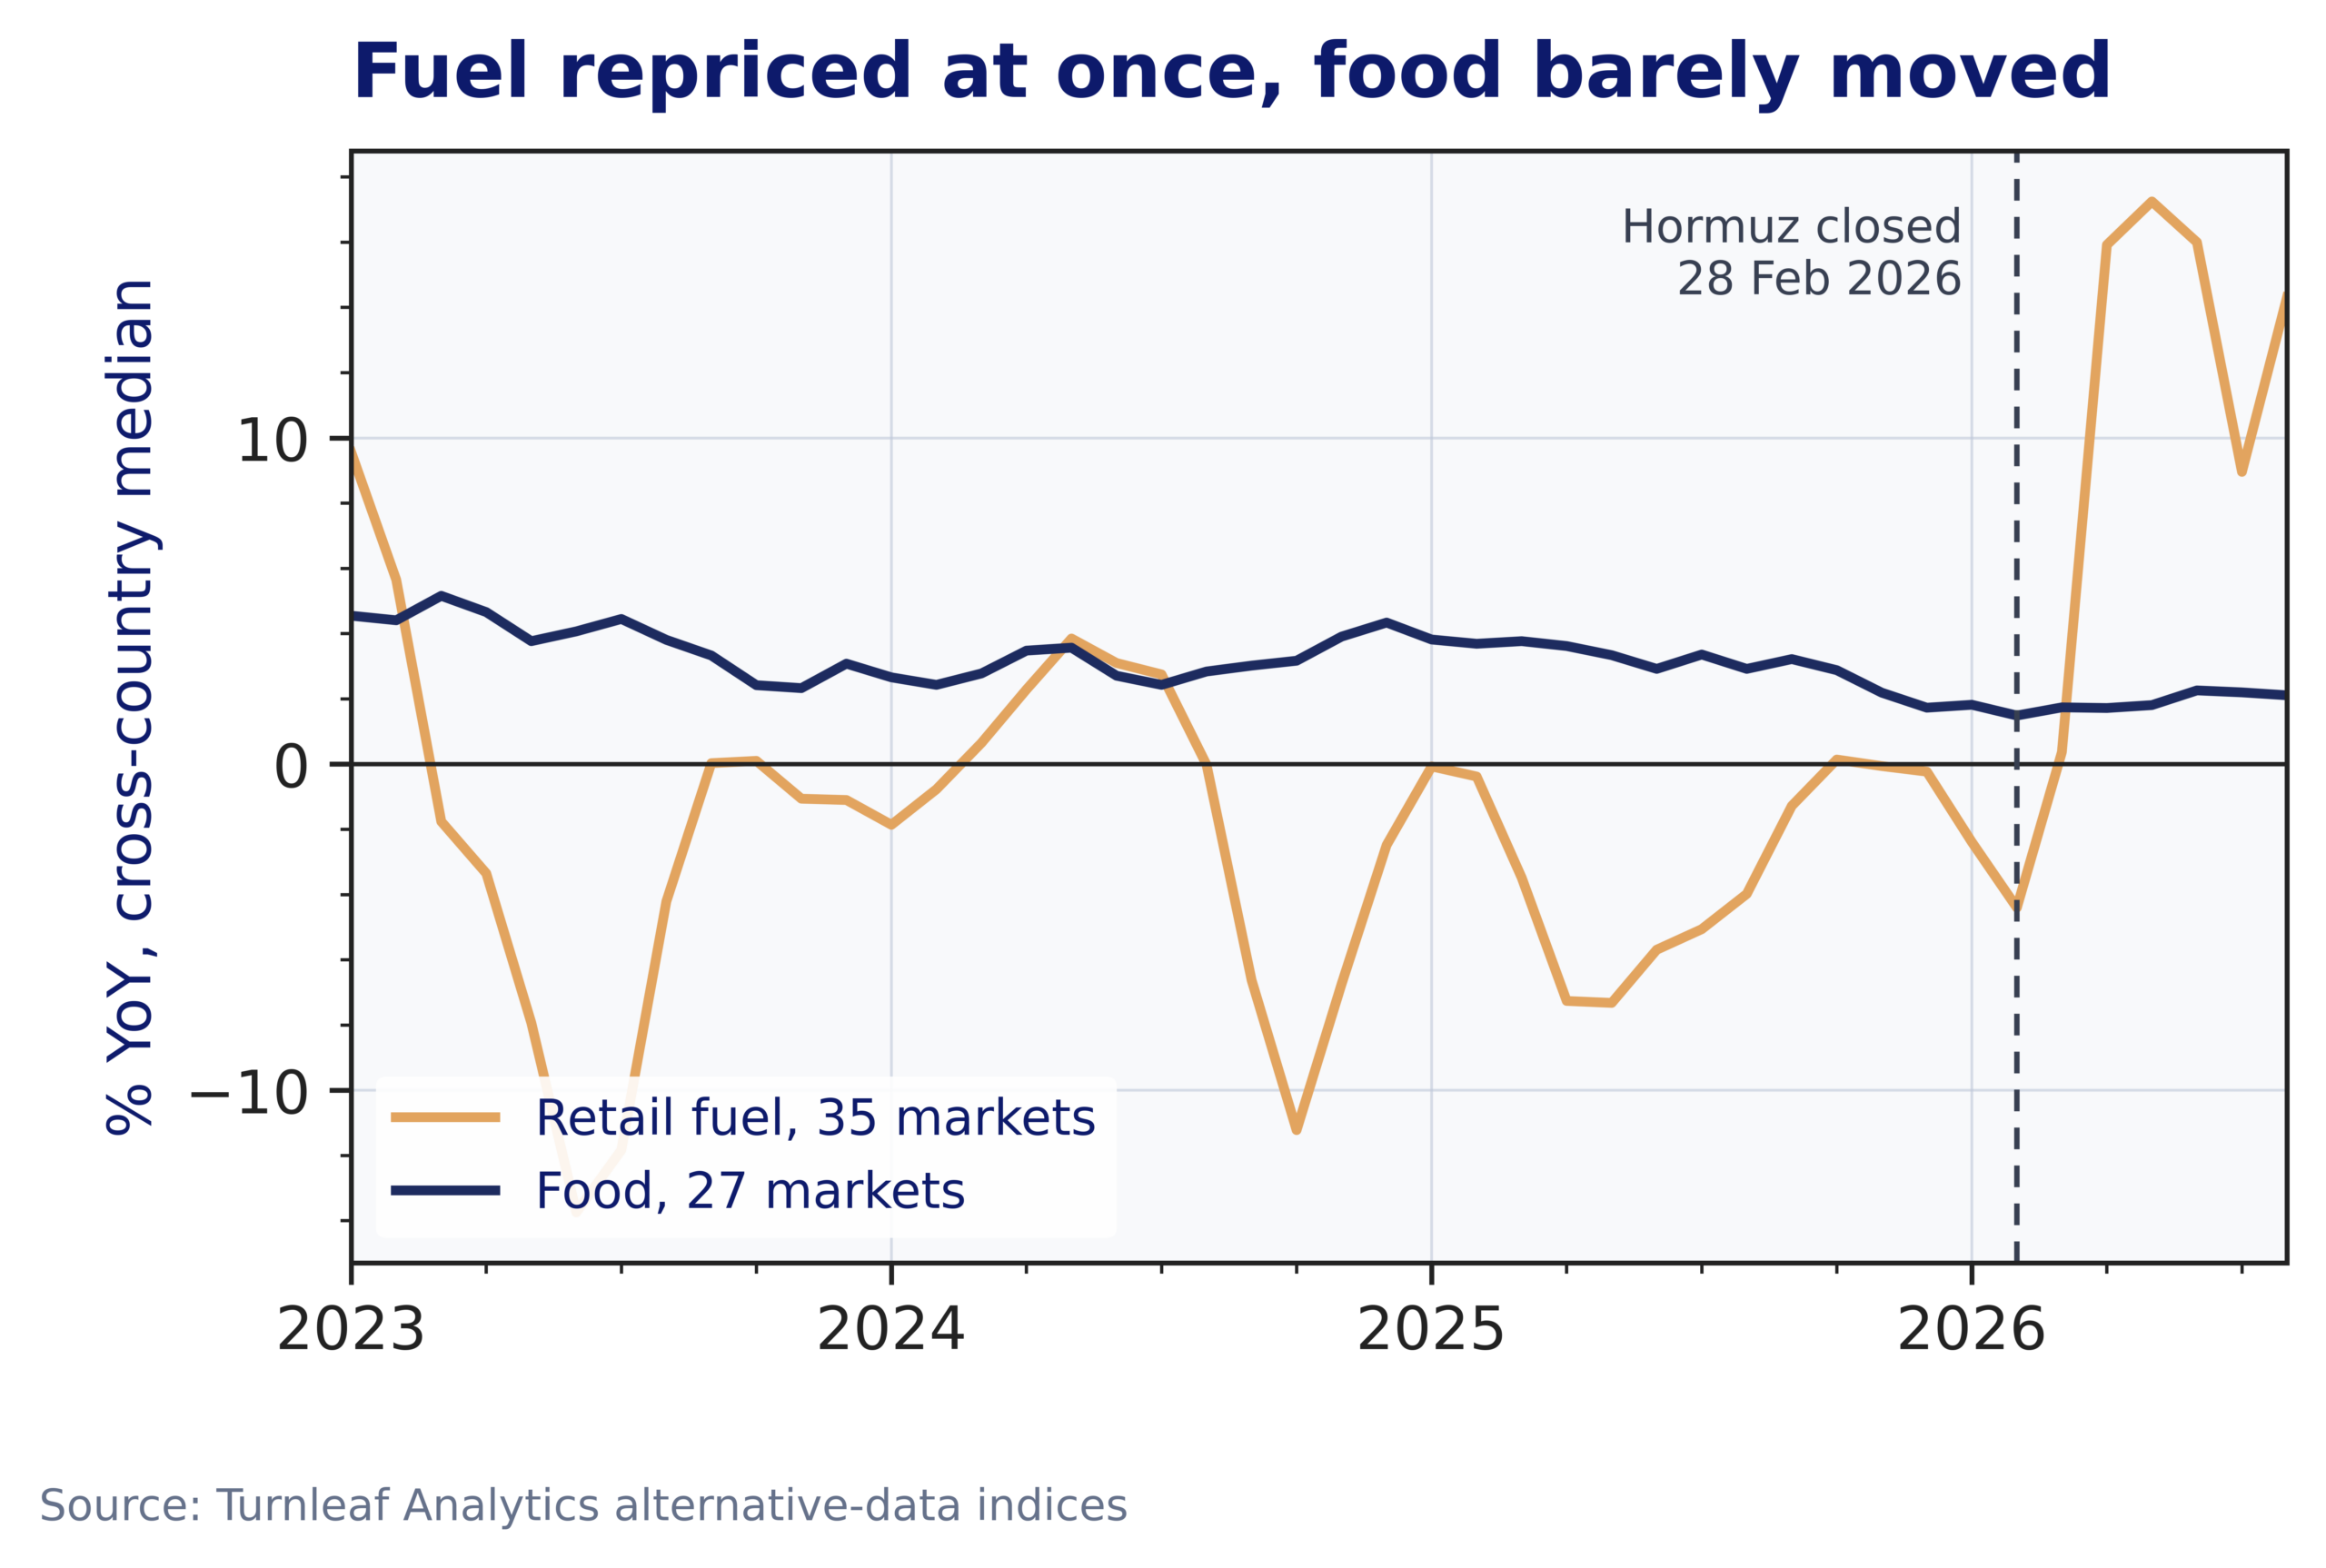
The temptation is to read that fade as the end of the episode. We think that would be premature, though the energy leg has delivered less to food than the input move implied. Momentum has returned to the 1.1% to 2.3% range it occupied in the three months before the closure. The slower effects through fertiliser costs and crop yields have yet to begin.
What the data show
Hormuz remains effectively closed. Kpler counted six transits on 3 September against a pre-war norm near 100 a day, and war-risk premiums run at 7.5% to 12.5% of hull value per transit against roughly 0.25% before the conflict. The US Energy Information Administration estimates crude and petroleum liquids through the strait averaged 4.9 million barrels a day in the second quarter of 2026, down from 21.6 million in the fourth quarter of 2025. Brent began the year at $61, passed $100 on 12 March and trades near $100 today.
Two other shocks landed on top. NOAA’s Climate Prediction Center issued an El Niño advisory on 13 August recording a Niño 3.4 anomaly of +1.4°C in July and putting the odds of a very strong event through the northern winter above 90%. The Panama Canal Authority cut daily transits to 34 from 3 September and to 32 from 15 September, with draft down to 47.5 feet, after below-normal rainfall left Gatun Lake just over 84 feet in late August. A single priority slot sold for a record $5.3 million at auction on 25 August.
Sixteen of our 27 food markets showed faster inflation over the six months after the closure than over the six months before it, with a median gain of 1.4 percentage points annualised. Over the equivalent window after Russia’s invasion of Ukraine, 20 of the same 27 accelerated by a median 1.3 points. This episode is narrower at the consumer level than that one was at the same stage, and 2022 went on to deliver most of its food inflation over the following year.
Figure 2. Seasonally adjusted food momentum and the share of markets rising.
How the shock reaches the shelf
The mechanism unfolds in three stages, each operating at a different speed.
The first stage is fuel. Diesel and petrol reprice within weeks of a crude move, and this is a direct cost to farming, processing, refrigeration and distribution. Measured on price levels, the median market saw retail fuel rise 12.8% comparing the June to August average with the December to February average. That is a change in the level of fuel prices and a different measure from the year-on-year inflation rates plotted in Figure 1.
The second stage is gas and fertiliser. Around a fifth of global LNG trade moved through the corridor, and QatarEnergy, which declared force majeure in early March, has extended cargo cancellations into early November and shipped 18 cargoes in the first six months of the conflict against 509 a year earlier. Nitrogen fertiliser is made from that gas, and the International Food Policy Research Institute estimates up to 30% of global fertiliser trade passed through Hormuz in 2024. The World Bank expects its fertiliser index to rise 31% across 2026, with urea up close to 60%.
The third stage is the harvest. Fertiliser affordability is at its weakest since mid-2022, and farmers respond by cutting applied rates or switching crops, which shows up in the 2026/27 and 2027/28 harvests. El Niño works on the same calendar. NOAA puts a 69% probability on a historic event in the October to December season, one exceeding a three-month relative index of +2.5°C, which would place Asian rice, Thai cane and southern African maize at risk together.
Where policy defers the shock
The cross-country dispersion in our fuel data traces the policy map. The United States is up more than 40% on price levels since the winter, and the United Kingdom, Czechia and Turkey are above 20%. India, Indonesia, Brazil and Chile register single digits. Several of those operate administered prices or stabilisation funds, and Indonesia has confirmed subsidised fuel prices unchanged through the end of 2026. The food response does not follow the same map. Latin America accelerated most, with all five markets positive and a mean gain of 5.2 points led by Brazil at 9.4 and Peru at 8.4. North America averaged 3.2. Europe was mixed, with a mean of 1.6 and only seven of twelve markets positive, Germany up 14.1 and France 4.9 against Sweden down 4.3 and Poland down 1.5. Emerging Asia averaged minus 1.0, with only China positive.
Figure 3. Change in seasonally adjusted food momentum by market, March to August 2026 against September 2025 to February 2026.
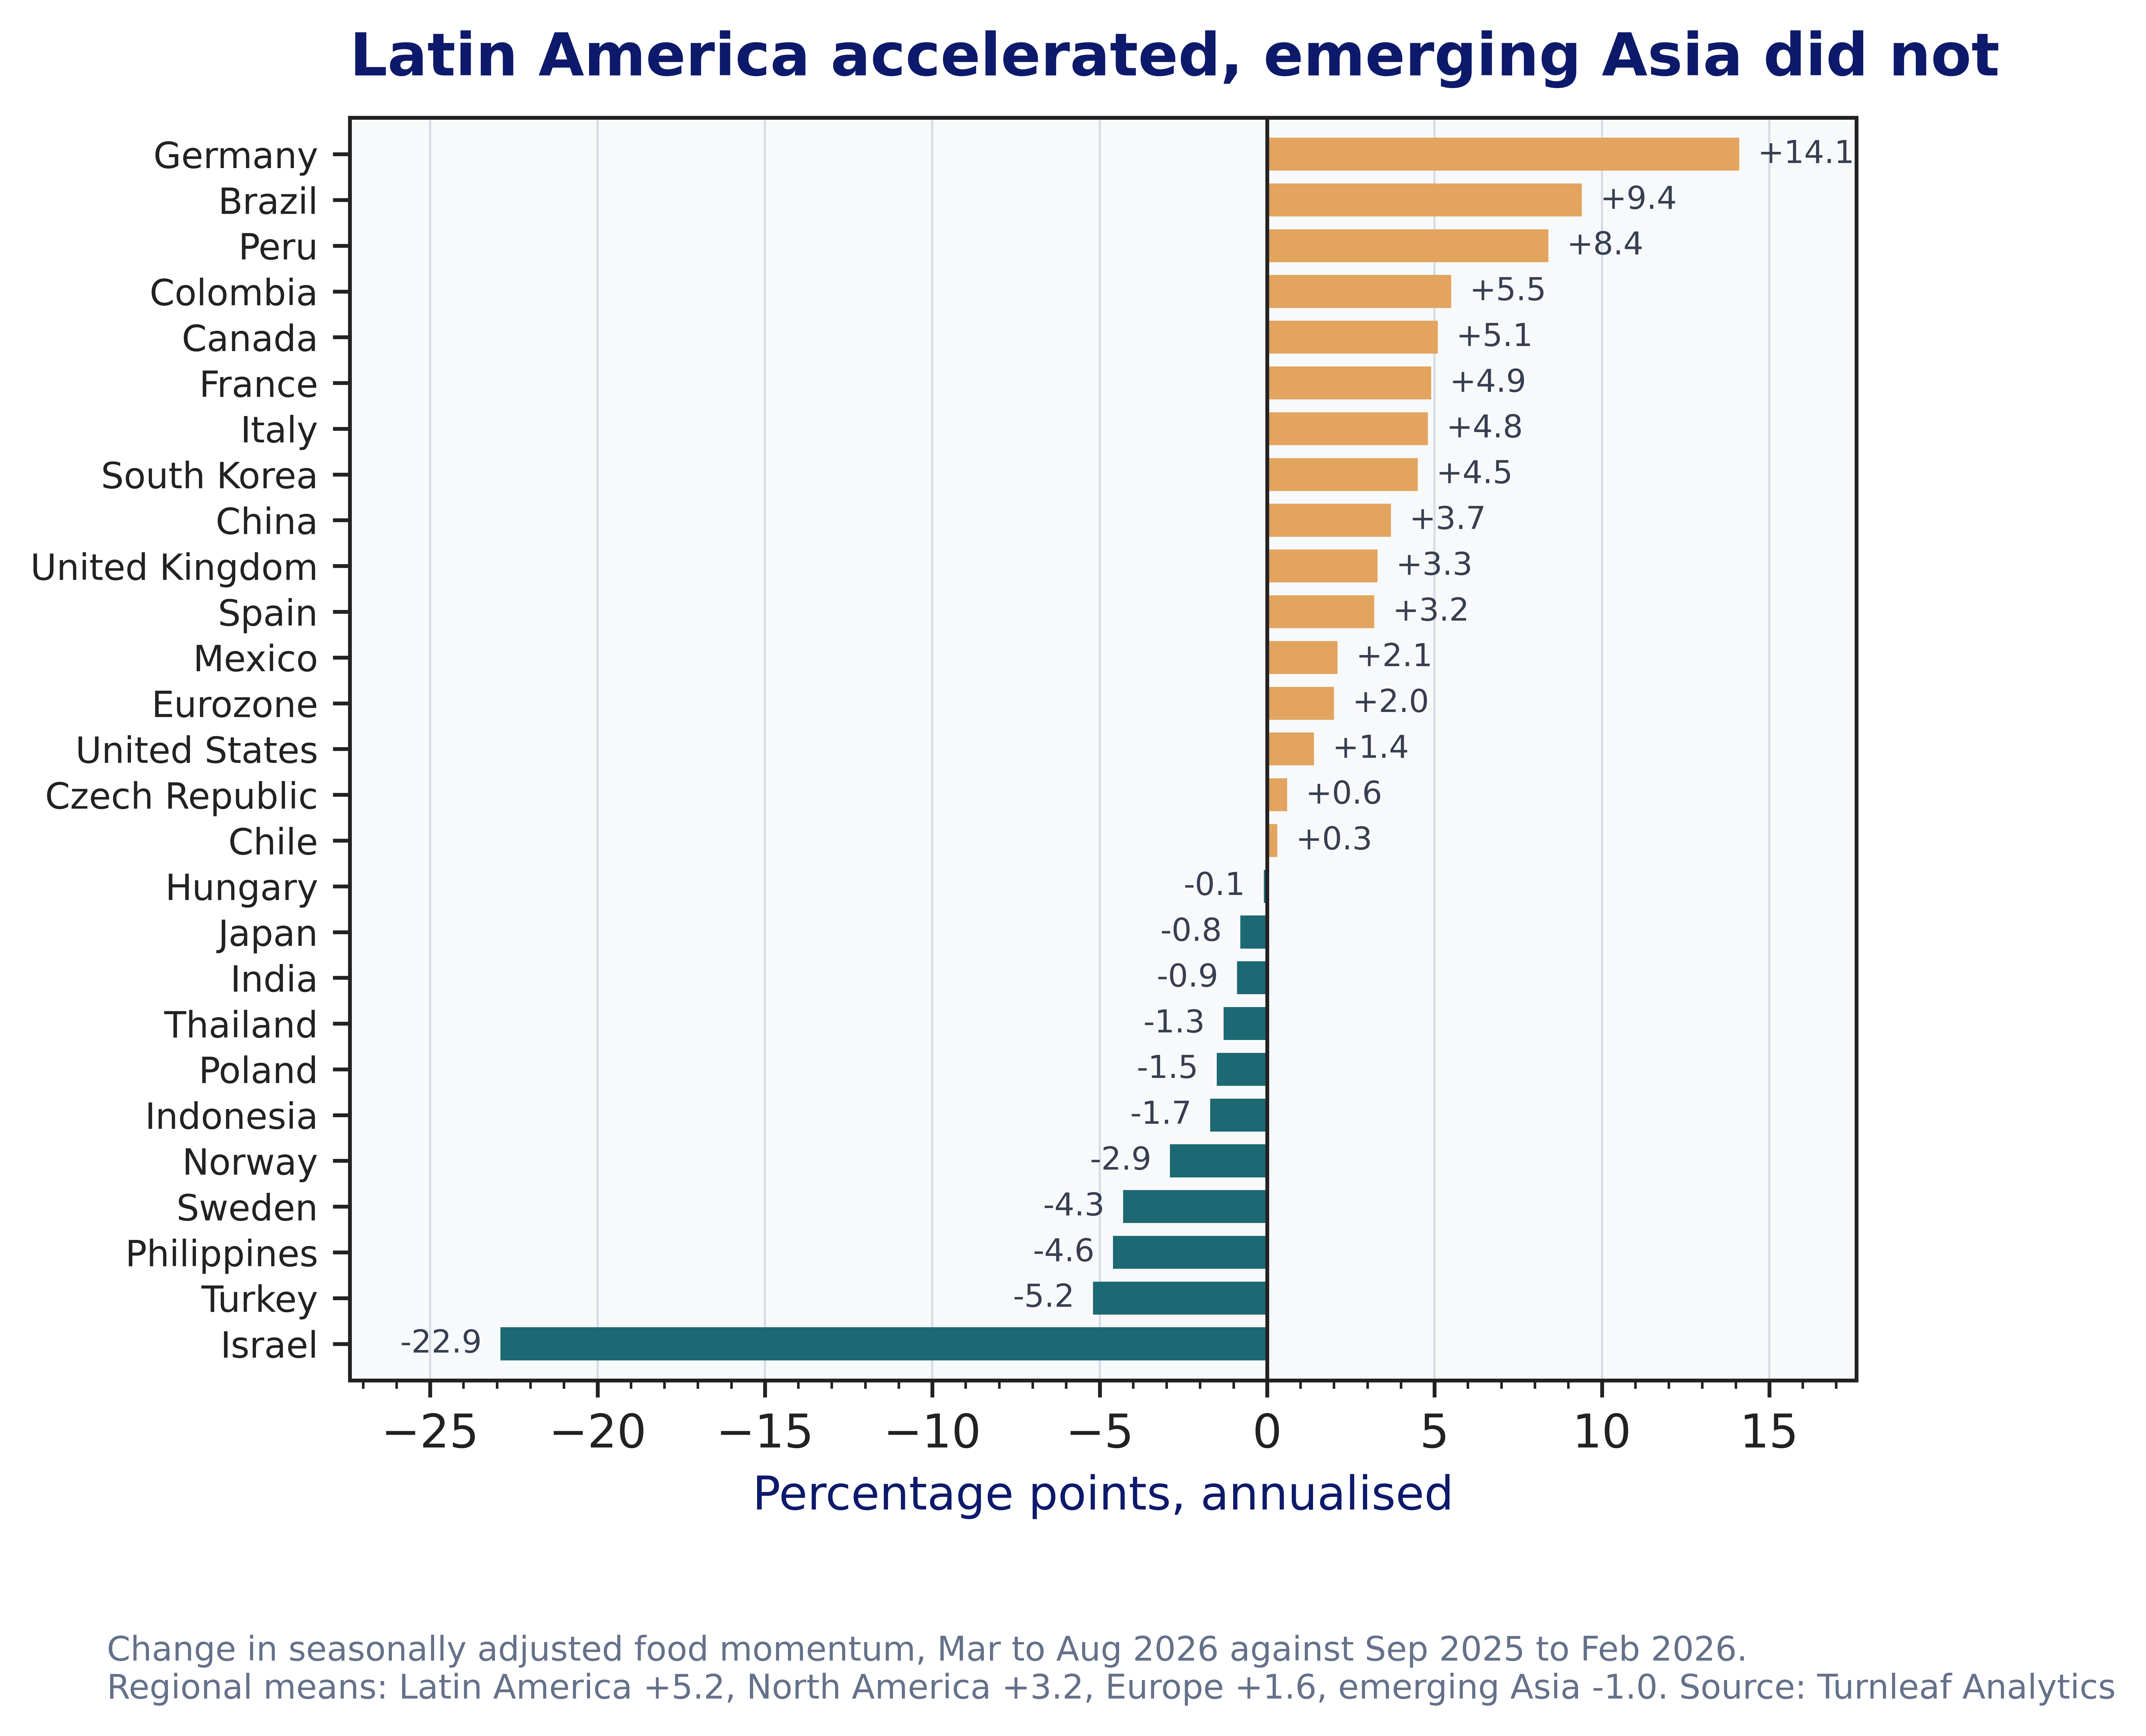
These measures need separating by what they actually do. Sweden cut the VAT rate on food from 12% to 6% on 1 April 2026, a reduction in the tax wedge that lowered food and non-alcoholic beverage prices 5.5% between March and April on Statistics Sweden data, and it runs to the end of 2027. Caps are different. They hold the retail price while the wholesale cost accrues elsewhere, and the pressure returns when the measure lapses. Czech daily fuel price caps, introduced in April, were scheduled to run only to the end of that month. The Philippine ₱50 per kilo cap on imported rice under Executive Order 118, signed on 13 May, carried a 30-day term with fortnightly review, so it suppressed a print without changing the landed cost of the grain.
The Turnleaf view
We expect global food inflation to reaccelerate from the fourth quarter of 2026 and to peak through the second and third quarters of 2027. The August data have weakened the energy leg of that case and left the argument resting on the slower channels. Momentum is back to where it stood before the closure and breadth has narrowed from 81% of markets rising in April to 70% in August. Fertiliser and El Niño carry the forecast from here.
Four things will settle whether this forecast holds.
Hormuz transit volumes and war-risk insurance premiums are the primary swing factor. The EIA assumes trade patterns normalise by early 2027 and forecasts Brent averaging $69 that year, which would remove what is left of the second-round impulse.
The October to December ENSO season matters more than the current reading, given the 69% probability NOAA attaches to a historic event.
Urea and DAP prices through the northern hemisphere planting season will show whether farmers are cutting applied rates, which is what converts a fertiliser price into a yield loss.
Finally, the policy calendar. Indonesia’s subsidy commitment expires on 31 December 2026. India’s sugar export prohibition, imposed on 13 May, runs to 30 September. China’s phosphate export suspension, announced in December 2025 and extended through August 2026, predates the Hormuz crisis and its renewal is a separate decision. Each of those dates is a point at which deferred pressure can arrive in the print.