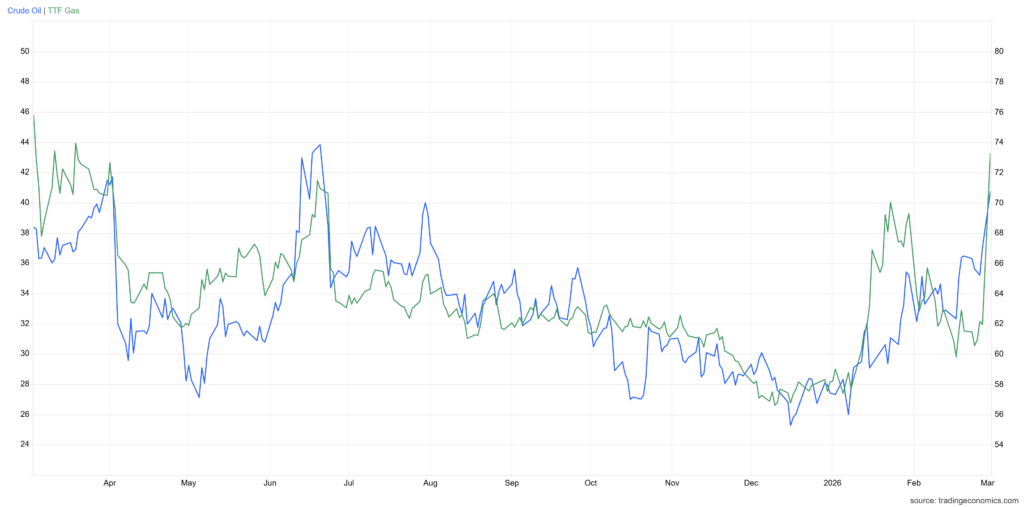
The US-Israel strike on Iran has pushed Middle East risk back to the center of global pricing. Crude has firmed into the low 70s while European gas prices spiked, and gold has extended an already sustained uptrend with a burst of volatility that suggests investors are actively rotating toward hard-asset hedges (Figure 1). For net energy importers, the near-term inflation distribution has shifted meaningfully to the upside.
Whether that shift proves transitory or persistent depends on duration. Futures markets have already repriced, but the physical supply layer has not yet confirmed or contradicted what is being priced. Turnleaf is monitoring that gap using high-frequency AIS-based routing, port call data, and commodity prices.
Figure 1
How the Twelve-Day War Priced Through to CPI
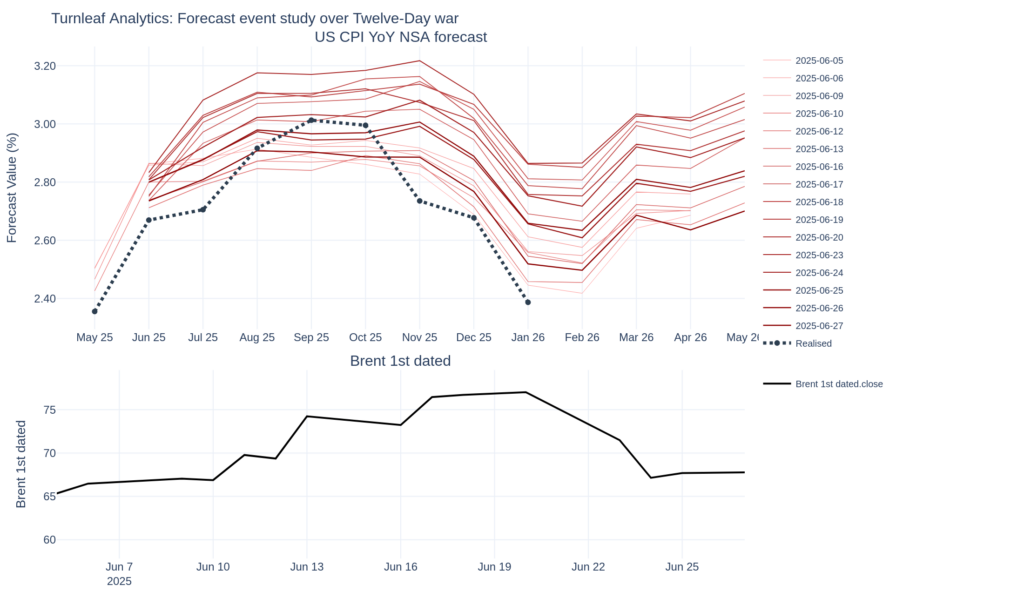
The June 2025 Twelve-Day War provides the most recent comparable template for how an energy shock of this kind transmits into consumer prices. As Brent crude rose approximately 10 dollars per barrel over the course of that conflict, Turnleaf’s daily US CPI year-on-year NSA forecast curve shifted upward by 30 to 40 basis points (Figure 2). After the ceasefire, the forecast curve reverted toward its pre-conflict trajectory and tracked the subsequent path of realized US CPI relatively well, confirming that markets priced the shock as transitory once supply pressure eased.
Higher crude prices feed through to transportation, manufacturing inputs, and food production, but conflict also disturbs components not conventionally thought of as energy-linked. Airline fares are a prominent example, responding both through kerosene costs and through the pent-up demand that releases when routes reopen after an airspace closure.
The current episode differs in two important respects. The geographic scope is substantially wider, with simultaneous pressure on Hormuz, the Red Sea, and Gulf LNG infrastructure rather than a more contained exchange. And the macro backdrop has shifted, with tariffs already adding to goods prices and structural gas demand running higher than it was twelve months ago. Even a similar crude price move could produce a larger and more persistent inflation pass-through.
Figure 2
The Strait of Hormuz and What It Means for Energy Costs
Roughly 20 million barrels of oil pass through the Strait of Hormuz each day, approximately a fifth of global petroleum liquids consumption. A sustained impairment cannot be quickly rerouted, and the freight and insurance costs that tanker owners are already building into rates will eventually reach the pump and, from there, the CPI basket.
Recent tanker call data show a meaningful decline relative to recent norms, though the figures do not yet include complete data through March 2, 2026. Kpler tracking data showed that traffic fell roughly 20 to 25 percent within hours of the initial strikes, with the majority of vessels either performing U-turns, idling, or diverting toward alternative routes. By late Saturday UTC, total reductions were approaching 75 percent relative to baseline. We expect tanker transit calls through the Strait of Hormuz to fall considerably in the next few weeks (Figure 3).
Figure 3
![]()
European Gas and the CPI Pass-Through
The EU imports approximately 58 percent of its total energy consumption. The post-2022 diversification shifted dependency toward Norwegian pipelines, US LNG, and Qatari LNG. It is that last source now under direct pressure, with QatarEnergy halting all LNG production at its Ras Laffan and Mesaieed facilities after Iranian drone strikes on Monday.
Italy generates roughly 38 to 44 percent of its electricity from natural gas depending on the period measured, making it the most exposed large economy in the bloc to a direct CPI pass-through from higher wholesale gas prices. Germany relies on gas for roughly 15 to 20 percent of its electricity generation with limited storage headroom. Rising structural demand from data centres and the ongoing coal-to-gas transition in Central European power generation make Europe more sensitive to an LNG supply shock in 2026 than it was in 2022, and Turnleaf has flagged both dynamics in previous reporting.
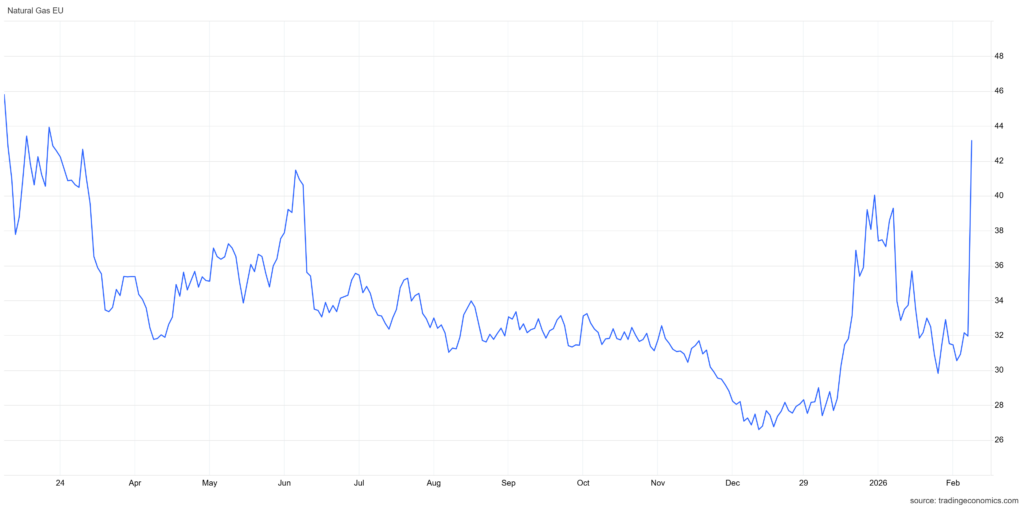
The TTF spike and partial retracement are consistent with repricing while the market waits for confirmation on duration. Even if the supply disruption is ultimately limited, the path through freight, insurance, and procurement competition can still raise costs, complicate inflation prints, and increase volatility in forward power and industrial input pricing. We will continue to monitor movements in natural gas futures and will account for them in our updated forecasts (Figure 4).
Figure 4
Who Gets Hit Hardest
The inflation channel operates through direct household energy costs; industrial input costs across manufacturing and chemicals; transportation and logistics via freight and air routes; and food production, where energy-intensive inputs and distribution costs amplify the pass-through well beyond headline energy prices.
Japan imports approximately 97 to 99 percent of both its oil and natural gas needs, placing it among the most structurally vulnerable large net energy importers to a sustained increase in global energy costs. South Korea faces similar risks. Different denominators: the 20 mb/d figure above is global consumption; the shares below use Persian Gulf departures and destinations. In 2024, 84 percent of crude oil and 83 percent of LNG leaving the Persian Gulf transited the Strait of Hormuz. China, India, Japan, and South Korea accounted for a combined 69 percent of all Hormuz crude flows.
To read the rest, visit our latest Substack post, here.