For the past few months, we have seen our forecasts for the Philippines adjust upwards as the central bank pivots from inflation-defensive to disinflation-offensive. Our Long-Term Contribution Word Cloud (Figure 1) help us identify key trends in bank assets, food, and energy, that are driving our forecasts.
Figure 1
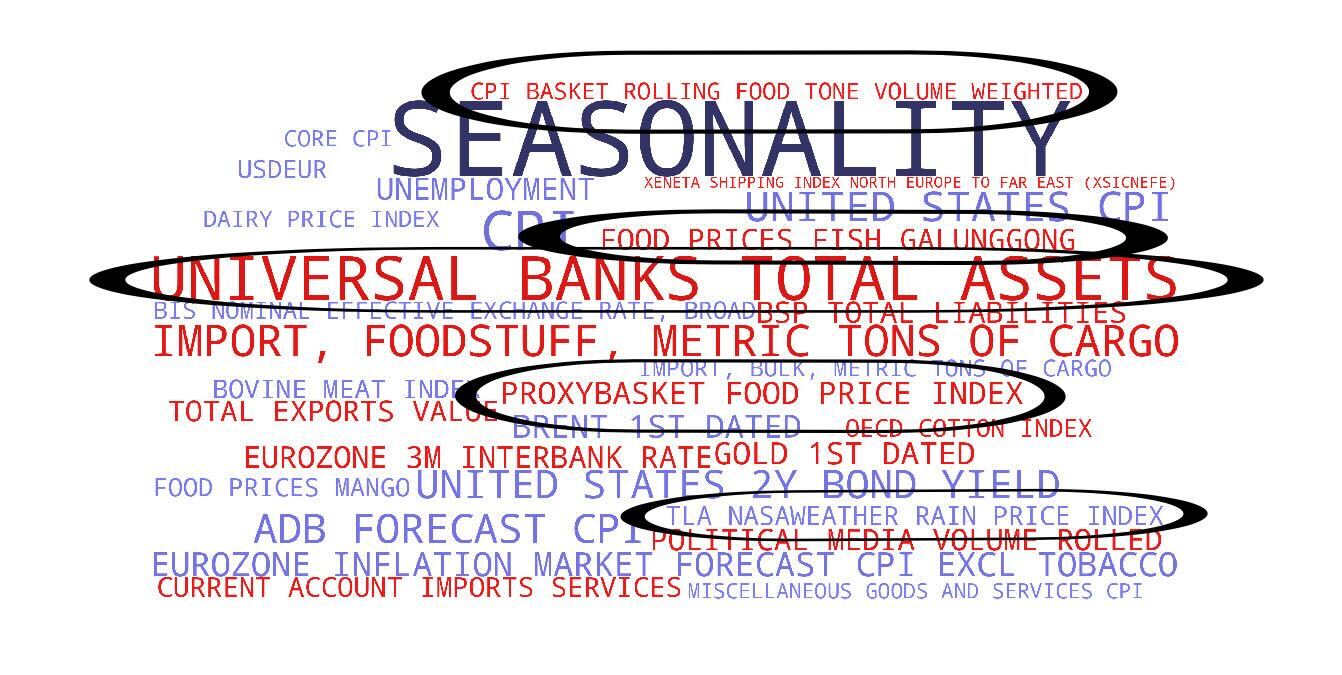 Subscribers can gain insights into the key drivers influencing Turnleaf’s CPI forecasts by examining our Word Cloud. Each term represents an economic indicator’s relative importance in our CPI model. The size of each word reflects its contribution magnitude to overall inflation predictions, helping subscribers quickly identify the most influential factors. The color coding further clarifies each indicator’s impact direction: blue words represent indicators with a disinflationary effect on CPI, while red words highlight inflationary factors.
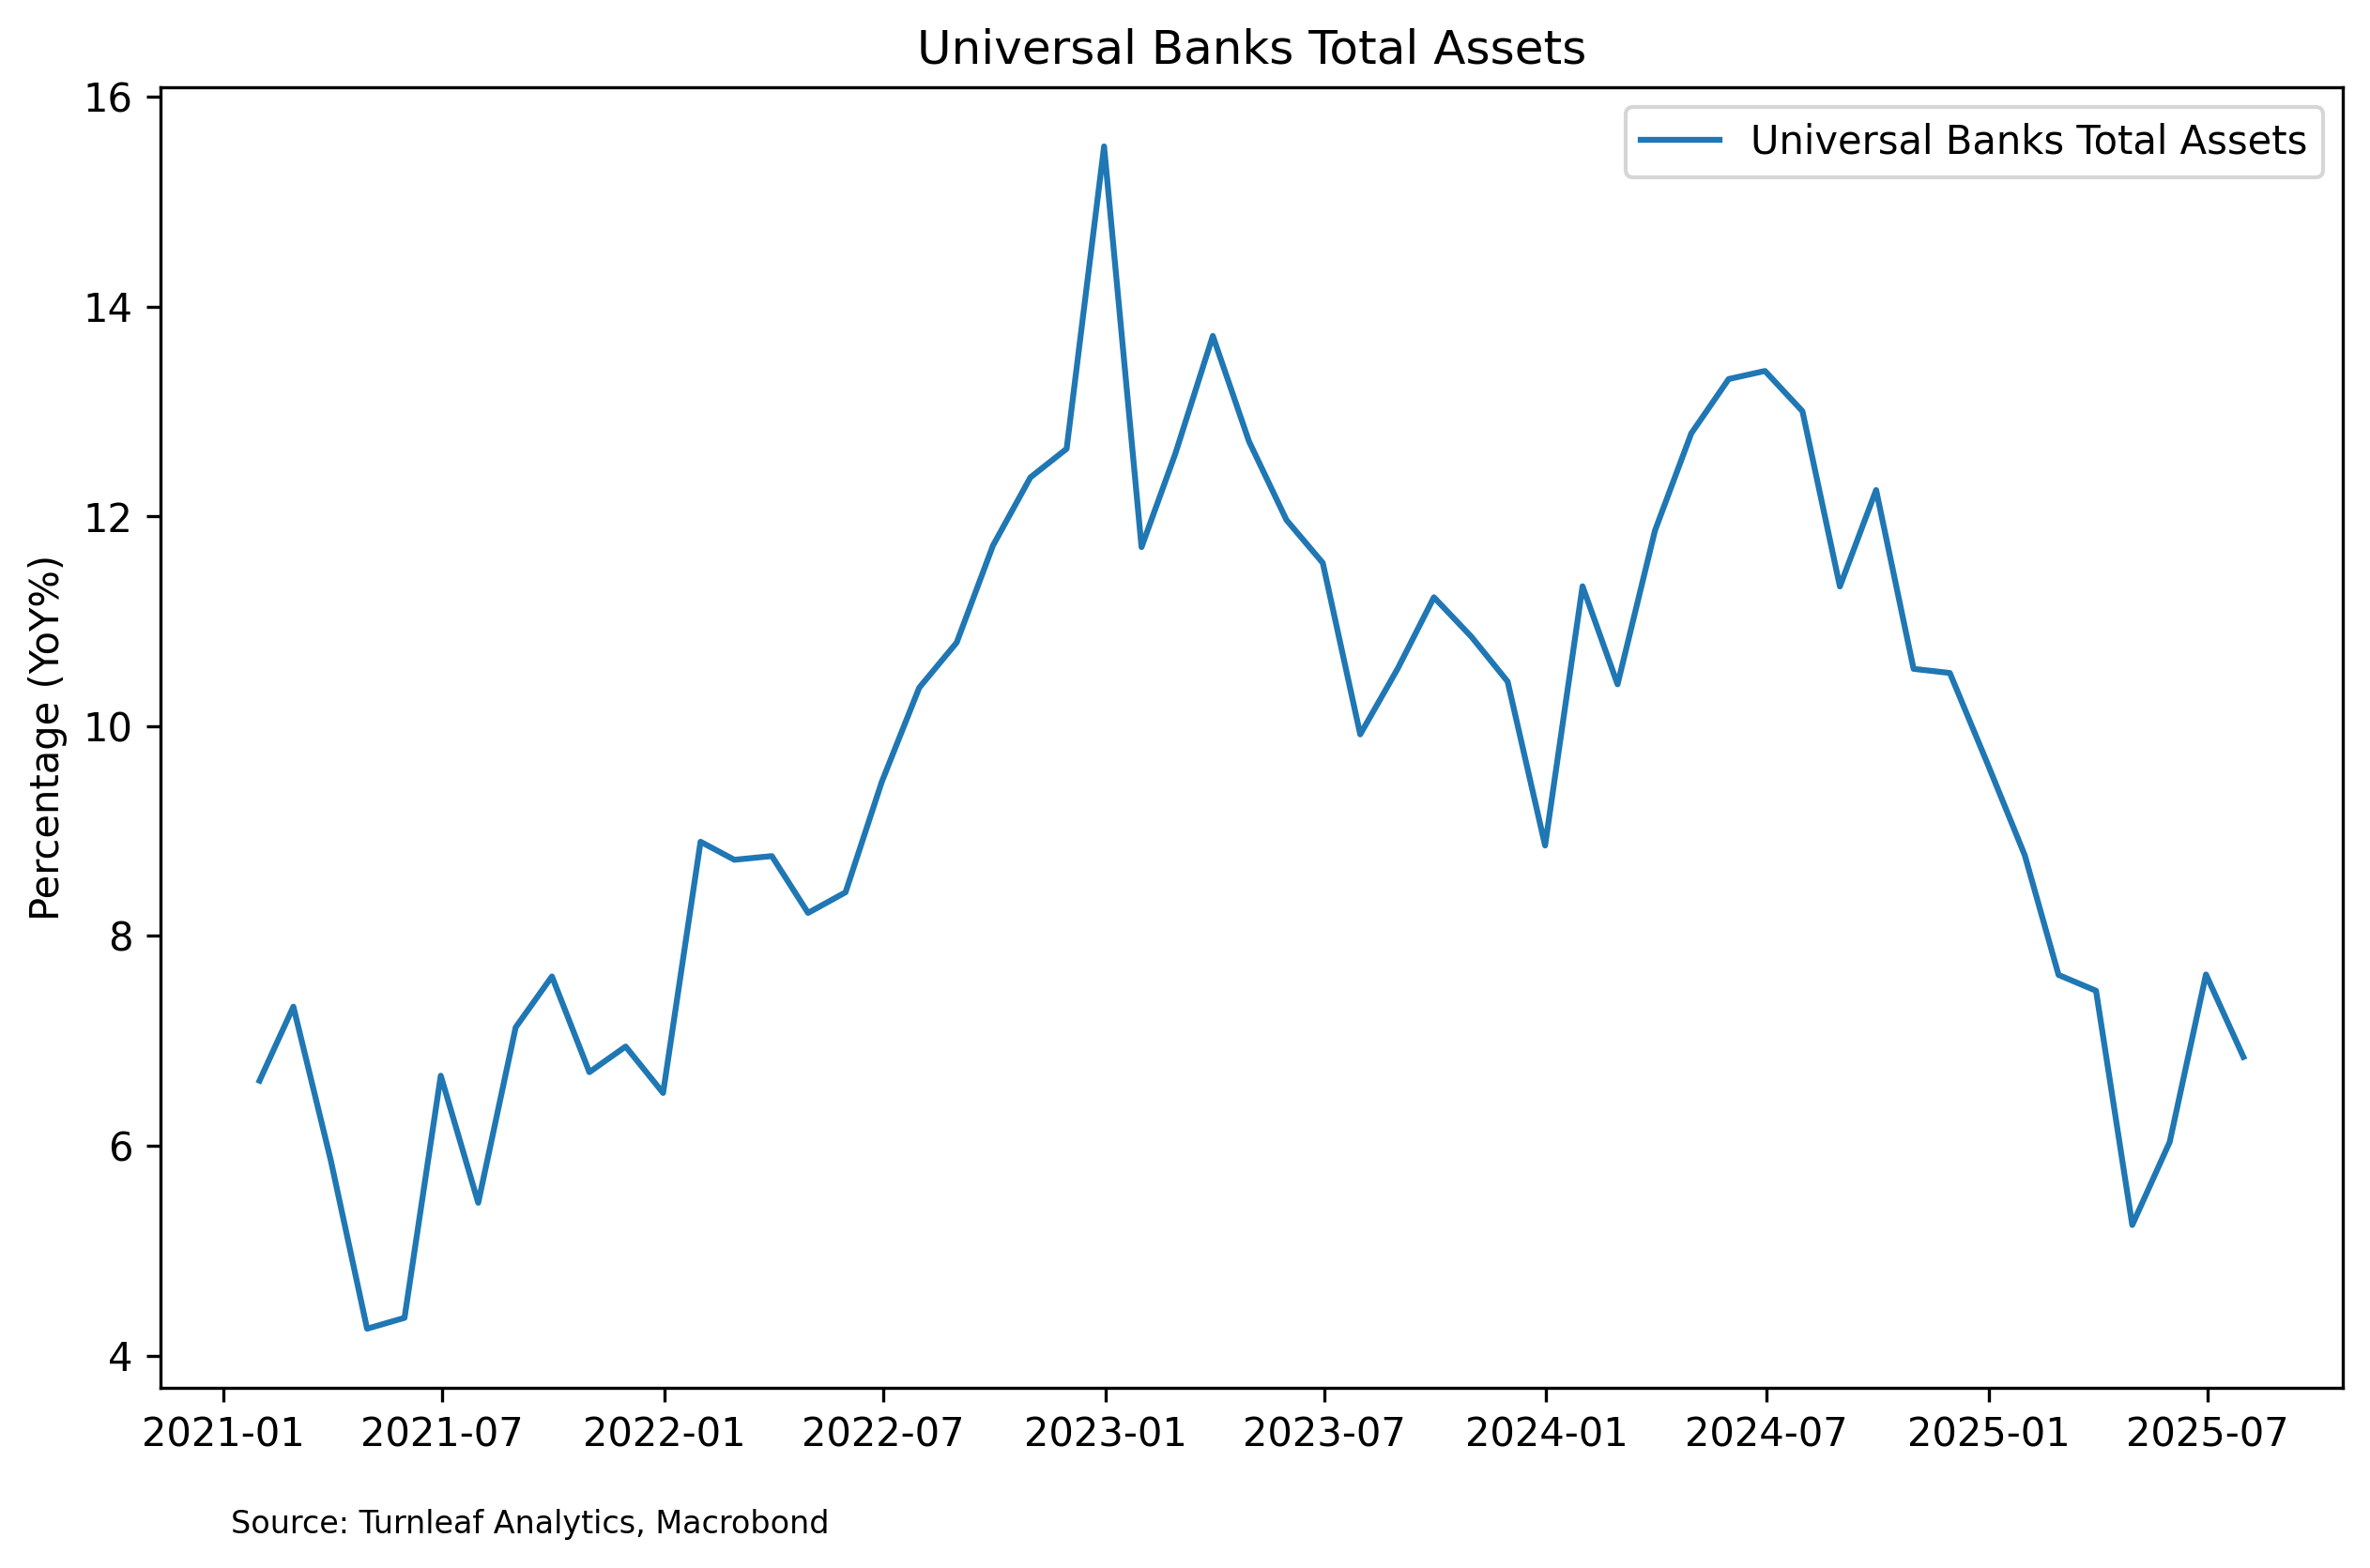
The long slowdown in financial aggregates like ‘universal banks’ total assets’ (Figure 2), due to restrictive monetary policy, has helped ease inflation over the previous year. But with the Philippines now close to the end of its easing cycle, a recent uptick in assets, is putting a gentle, early upside pressure to core inflation over the next few months. We expect that if the recent upswing in assets is loan-driven, growth-driven inflation pressures will drive inflation toward its 2-4% inflation target through 2026.
Figure 2
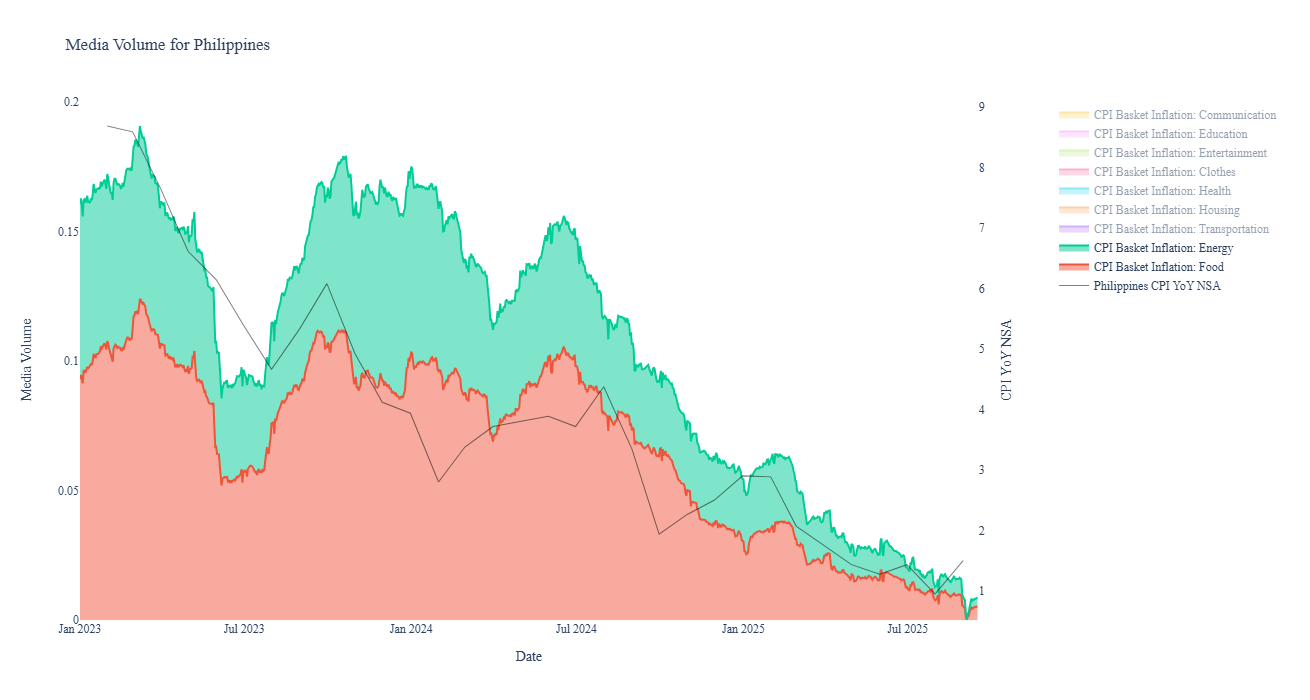
Headline inflation is expected to largely depend on energy and food prices, which have seen some price movements in recent months with our proprietary ‘Media Volume’ indicator for Food and Energy CPI baskets pointing towards a slight upswing (Figure 3).
Figure 3
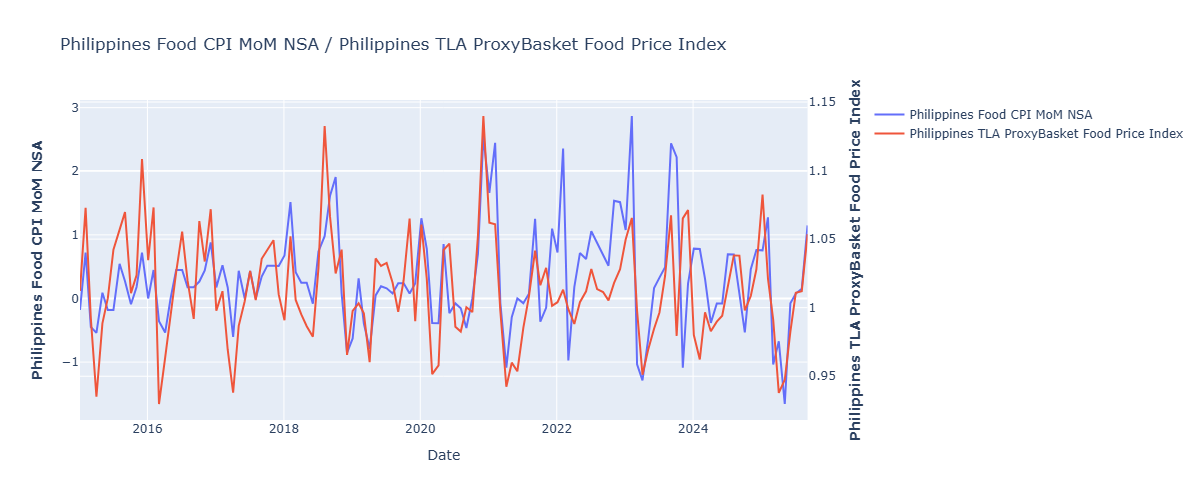
Energy prices, highlighted by persistently low Brent crude, have kept inflation muted. But, food prices, though evidently slowing down, are expected to put some upward pressure on our forecast in the medium term. We use Turnleaf’s Food Proxy Basket Index, which covers key rice and fish products and is highly correlated with Food CPI (MoM, NSA), as the primary high-frequency gauge (Figure 4).
Figure 4
For the rest of the article, please subscribe to Turnleaf’s Substack.