India’s National Statistical Office launched a new Consumer Price Index series on February 12, 2026, shifting the base year from 2012 to 2024 and overhauling the basket composition to reflect current household spending patterns. The most consequential change is the reduction in the weight of food and beverages from 45.86% to 36.75%. At the same time, housing and utilities, transport and communication, and services-related categories all gained share. These shifts, combined with methodological improvements to price collection and index computation, will alter the statistical properties of headline CPI and require recalibration of Turnleaf’s inflation forecasting models.
What Changed: The New CPI Basket
The 2024-base CPI replaces the 2012-base series that had been in use for over a decade. The updated weights are drawn from the 2023-24 Household Consumer Expenditure Survey and reflect a structural shift in Indian consumption toward non-food goods and services. The classification framework has also been modernized, moving from 6 broad groups to 12 COICOP-aligned divisions.
The table below summarizes the most important weight changes across major categories.
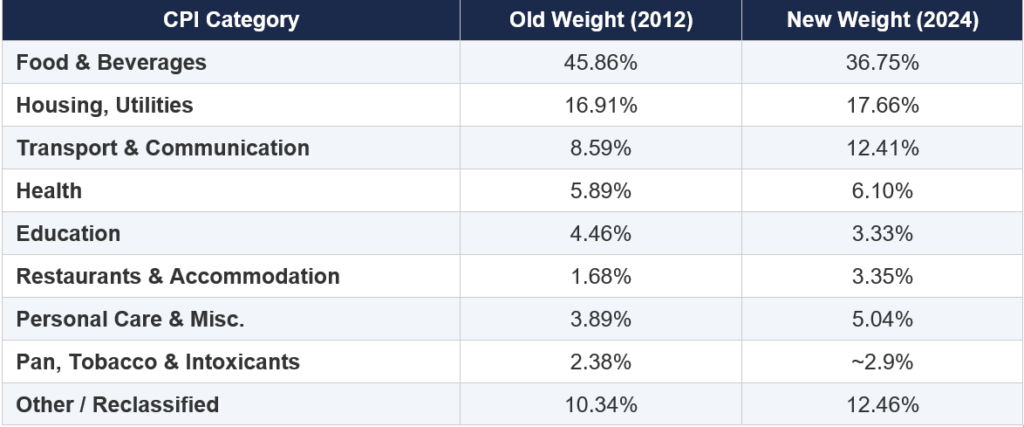
Source: MOSPI Expert Committee Report, Economic Times, Reuters. Old ‘Housing, Utilities’ combines Housing (10.07%) and Fuel & Light (6.84%).
Beyond the weight changes, the new series expands item coverage from 299 to 358 items, incorporating e-commerce prices, telecom data plans, and OTT streaming subscriptions for the first time. Price collection now spans 1,465 rural and 1,395 urban markets (up from 1,181 and 1,114), along with 12 online marketplaces. The NSO has also adopted the Jevons (geometric mean) formula for elementary price aggregation, replacing the arithmetic mean approach, which is expected to reduce upward bias in sub-index calculations.
Why It Matters for Inflation Forecasting
Reduced Food-Price Volatility in Headline CPI
Food prices in India exhibit strong seasonality tied to monsoon patterns, harvest cycles, and government procurement operations. Under the old basket, food and beverages accounted for nearly half of the index, meaning that a 1% change in food prices moved headline CPI by approximately 0.46 percentage points. Under the new weights, that passthrough drops to roughly 0.37 percentage points. The practical effect is that headline CPI will be less volatile on a month-to-month basis. Seasonal food-price spikes that previously generated sharp headline inflation readings will now register as more moderate movements. Conversely, periods of food price relief that often shifted our nowcast lower than the forecast will provide less of a deflationary pull on the headline number.
For Turnleaf’s models, which have been calibrated on a decade of data where food was the dominant driver of headline CPI variation, this is a significant change. Historical patterns of seasonal amplitude, peak-to-trough swings, and food-driven forecast errors will not carry forward with the same magnitudes.
Greater Weight on Core and Services Inflation
The combined weight of non-food categories has risen from roughly 54% to 63% of the index. Housing and utilities (17.66%), transport and communication (12.41%), and health (6.10%) are all larger components than before. The new “Restaurants & Accommodation” category (3.35%) captures a spending pattern that was barely visible in the old basket. Taken together, services and core goods now exert considerably more influence on headline inflation.
Core inflation in India tends to be stickier and more responsive to demand-side factors such as the output gap, wage growth, and exchange rate movements, whereas food inflation is primarily supply-driven. Models that historically relied on food prices as the dominant explanatory variable for headline CPI will find that core inflation dynamics, particularly housing rents and services prices, now explain a larger share of headline variation. Turnleaf’s feature importance rankings will shift accordingly.
A Modest Upward Level Shift
Analysts at SBI Research and the Reserve Bank of India have estimated that the basket revision will impart an upward bias of approximately 0.2 to 0.4% to reported inflation, all else equal. This reflects the fact that core items, particularly services, have been experiencing higher inflation than food in recent quarters. When those items receive greater weight, the measured headline rate mechanically rises. This is not a change in underlying price dynamics but rather a measurement effect that forecasting models need to absorb.
For context, SBI Research noted that measured inflation in 2025 under the old basket averaged roughly 2.2%, but would have registered approximately 2.4 to 2.5% under the new weights. This 20 to 30 basis point gap is the practical magnitude of the level shift that Turnleaf’s model now accounts for.
Handling the Structural Break
To read the rest, check our Turnleaf’s latest Substack post, here.