At the end of May 2025, the Orban government decided to extend the profit margin cap on 30 essential food items through August 2025, in line with previous guidance stating the cap would continue if food inflation did not drop below 5%. Local reports initially indicated deep price discounts shortly after the implementation of the policy, but some items have since experienced markups. Notably, food inflation in May 2025 rose to 0.55%MoM, up from -2.8%MoM in the previous month, suggesting either diminished effectiveness of the controls or persistent structural inflationary pressures in the food sector. As a result, our model has started to indicate increasing inflation forecasts driven by upward pressures from our food proxy basket, which includes most of the 30 items subject to the margin cap (Figure 1).
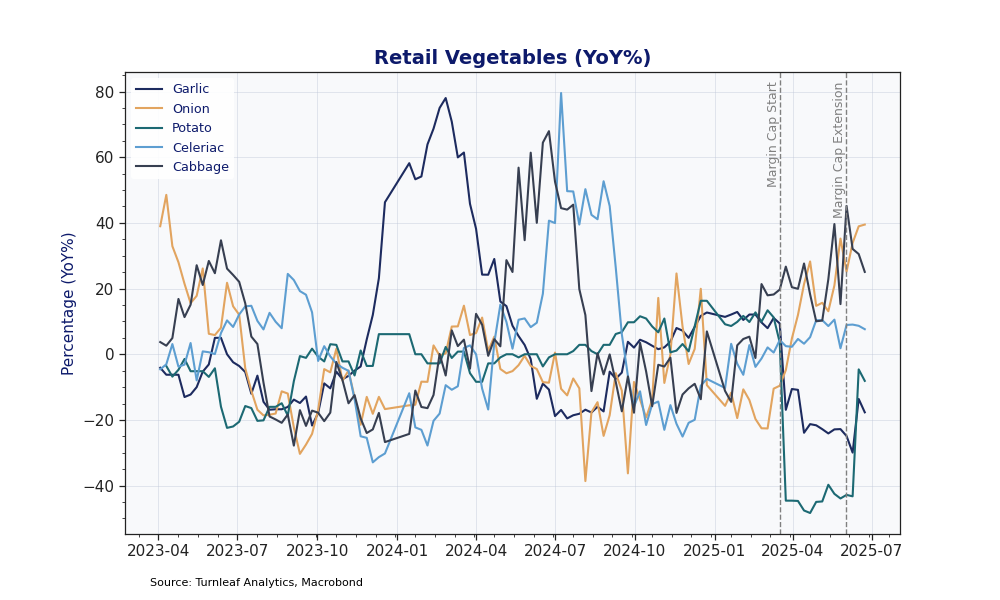
Figure 1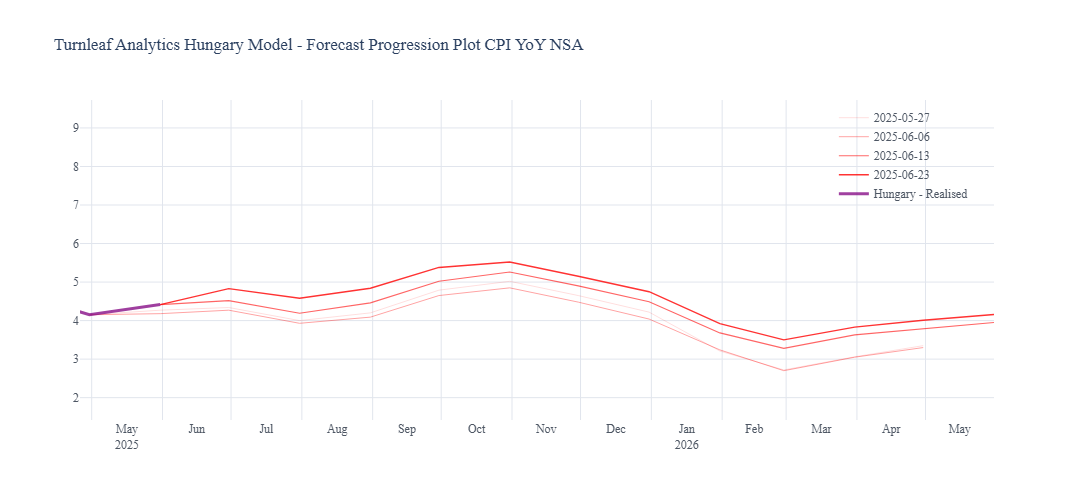 To identify the drivers within our food basket, we analyzed individual weekly price data and their pricing responses relative to the timing of the margin cap implementation. Two key trends emerge: first, select dairy products saw sharp initial price declines after the caps began, only to rise again following the cap extension (Figure 2a). Second, potatoes exhibited a similar price behavior (Figure 2b).
Figure 2a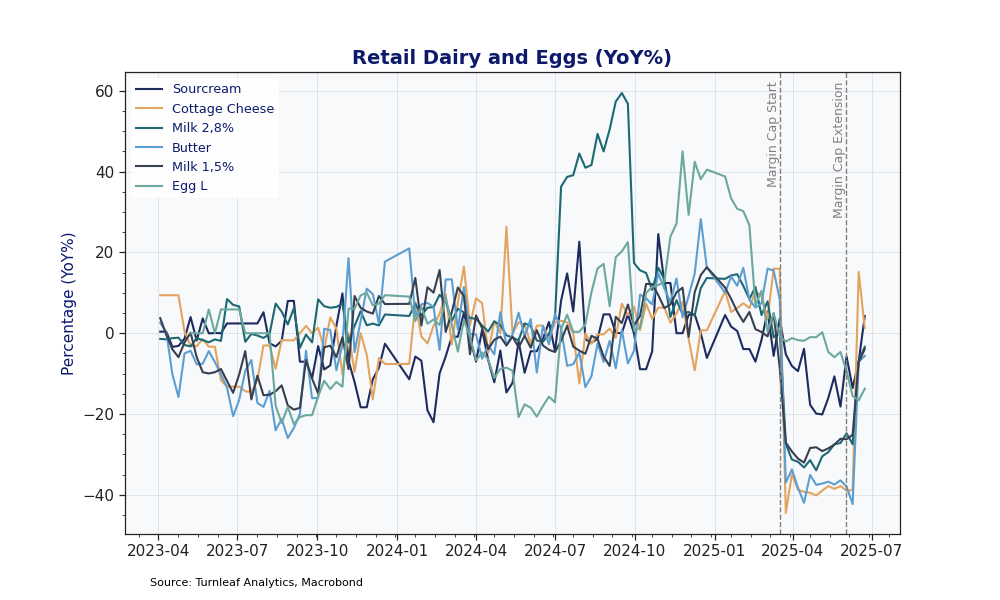
Figure2b
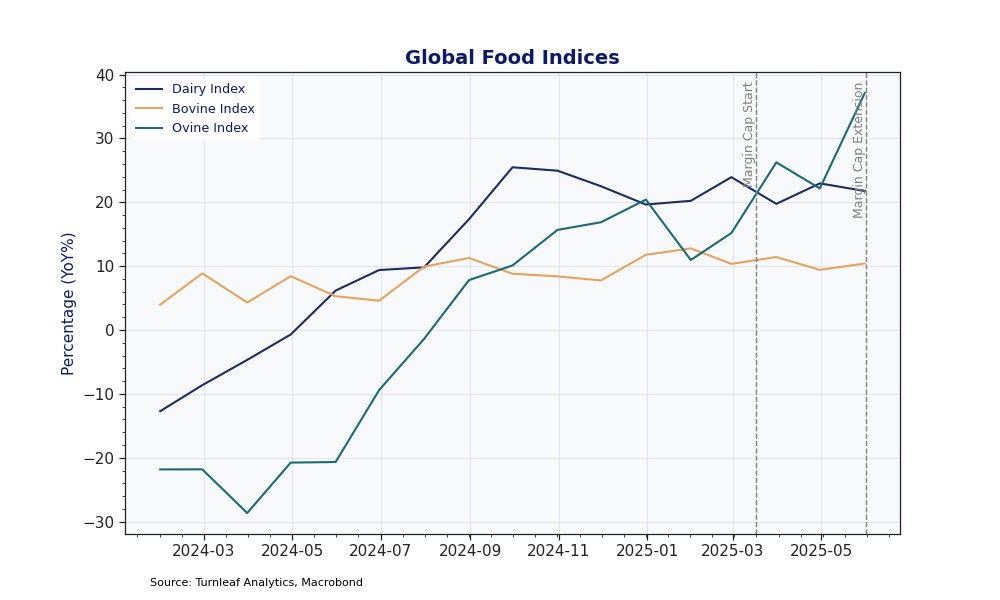
 These sudden changes in domestic retail prices are suspiciously aligned with policy timelines rather than global market dynamics, as global food indices did not show comparable volatility (Figure 3).
Figure 3
 Government statements have frequently accused multinational corporations of excessively marking up prices to the detriment of Hungarian households. On June 18, 2025, the European Commission issued a formal complaint alleging that Hungary is forcing multinational companies to operate at a loss. Hungary responded aggressively, maintaining its stance that multinational companies are responsible for high domestic food prices. This stance has crucial implications: Hungary’s policy disproportionally impacts multinationals, particularly affecting imported food items which include milk and potatoes.
Food items dominated by domestic producers continue to see price increases driven by underlying producer cost pressures. Indeed, domestic PPI for Food Products, Beverages, and Tobacco has steadily risen since early 2024, following declines throughout 2023 (Figure 4). A significant base effect from 2024 prompted a sharp producer price spike at the start of 2025, translating into notably stronger retail food price inflation.
Figure 4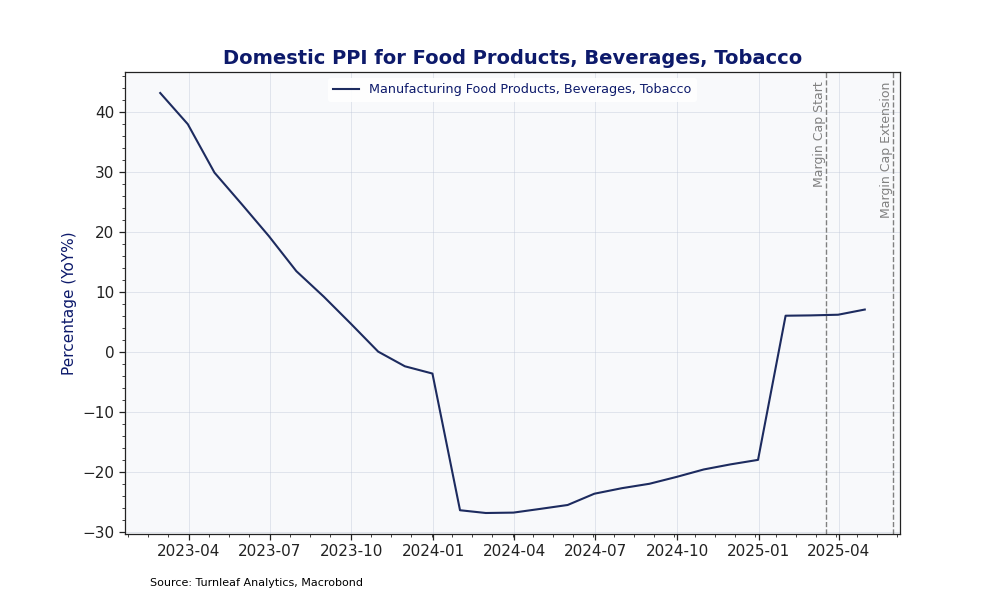
Additionally, restaurant and catering prices—driven primarily by tangible inputs (food) and services—reveal divergent trends when compared with market services indicators (Figure 5). Market services have demonstrated moderate month-on-month declines, whereas food prices continue to face upward pressure, especially pronounced from mid-coverage period through June 2025.
Figure 5

Overall, food inflation remains a key driver of Hungary’s overall inflation outlook. Persistently rising prices despite margin cap measures suggest a considerable upward risk when the policy eventually ends, particularly if the government cannot effectively manage subsequent retail price hikes. Rising input costs in Hungary’s food manufacturing sector, combined with a dependency on multinational imports for essential food items, continue to place considerable upward pressure on overall inflation forecasts.
Word Cloud Contribution Plot, Hungary, May 2025
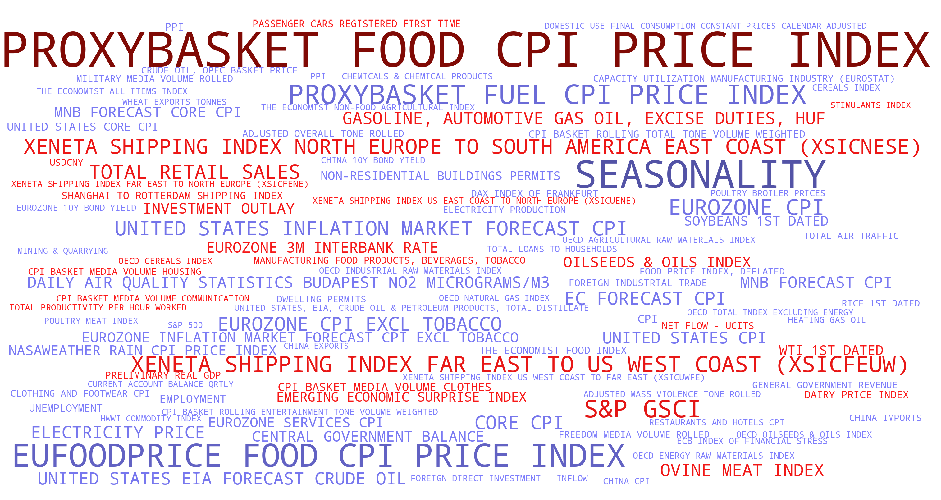
Subscribers can gain insights into the key drivers influencing Turnleaf’s CPI forecasts by examining our Word Cloud. Each term represents an economic indicator’s relative importance in our CPI model. The size of each word reflects its contribution magnitude to overall inflation predictions, helping subscribers quickly identify the most influential factors. The color coding further clarifies each indicator’s impact direction: blue words represent indicators with a disinflationary effect on CPI, while red words highlight inflationary factors. For instance, ‘Inflation Market Forecast’ is large, indicating their significant weight in the model, while its color suggests whether it contribute to higher or lower inflation trends. This Word Cloud enables a quick, visual analysis of the complex landscape of inflationary and disinflationary influences in our forecasting model.