The closure of the Strait of Hormuz following the US-Israeli strikes on Iran on 28 February 2026 has triggered the largest physical supply disruption in the history of the global oil market. Brent rose from roughly $69 per barrel in February to a peak of $126, before stabilising in the $100-110 range through late March. European gas prices increased by around 60-70% over the same period. The IEA’s 400 million barrel strategic reserve release, its largest ever, has failed to restore normal pricing.
Unlike the 2022 Russia-Ukraine shock, which was sanctions-driven and at least partly reroutable, this is a direct chokepoint disruption. It affects roughly 20 million barrels per day of crude flows and around one-fifth of global LNG trade.
From Front-End Shock to Structural Repricing
The oil curve still shows a shock concentrated at the front end (Figure 1), but the inflation signal is more complex. Pricing across maturities reflects not only current scarcity, but also the market’s evolving assessment of supply conditions, replacement costs, and geopolitical risk over time. Recent shifts in the curve suggest that, while the immediate disruption is severe, energy costs are likely to remain higher over the medium term. That helps explain why inflation pressures beyond the near term can continue to build even as the oil market concentrates the shock at the front end.
Figure 1
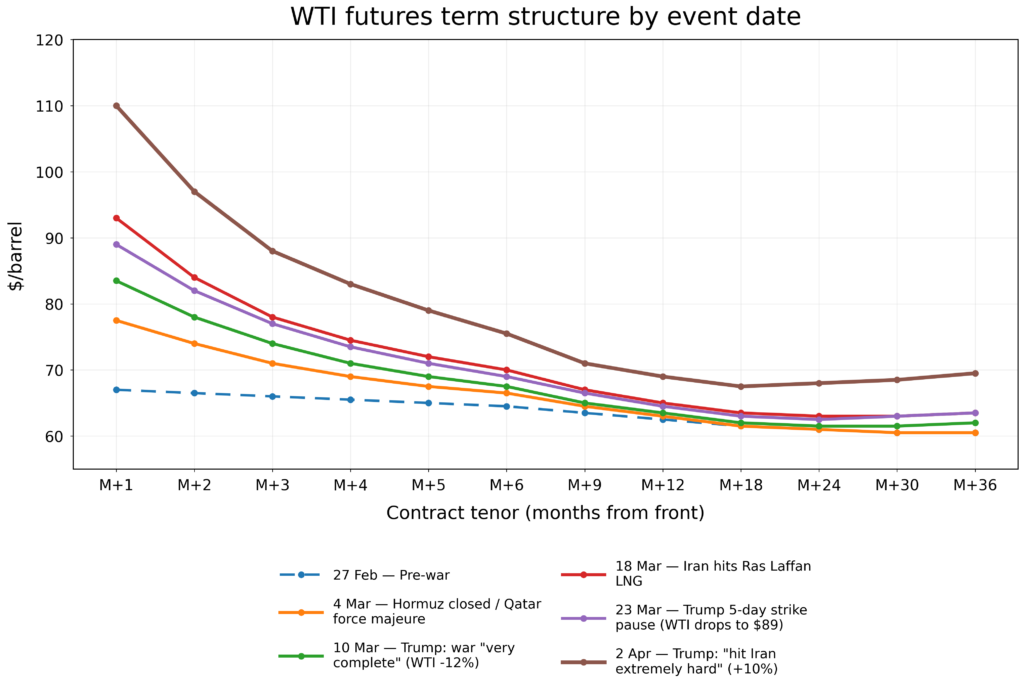
What the Oil Curve Is Actually Telling Us
The move in the curve suggests that the market has shifted from treating the Hormuz disruption as a temporary front-end shock to embedding a more persistent increase in medium-term energy costs (Figure 1). Before the war, on 27 February, the WTI term structure was broadly flat in the mid-$60s. By 4 March, after Iran formally closed the Strait and QatarEnergy declared force majeure, front-month WTI had risen to $77.5 while the back end remained largely unchanged. At that stage, pricing still reflected a view that the disruption was severe but likely temporary.
That interpretation weakened as the crisis escalated, particularly after the 18 March Ras Laffan attack. Front-month WTI rose to $93, but the more important shift occurred further out the curve: contracts from M+24 through M+36 increased from roughly $60-61 to around $63-63.5. The longer-dated move is consistent with the market placing greater weight on prolonged infrastructure damage, a more persistent geopolitical risk premium, and a higher marginal cost of replacement supply.
Subsequent periods of de-escalation eased pressure at the front of the curve, but they did not reverse the rise further out. By 2 April, front-month WTI was at $110, while M+36 remained at $69.5, still nearly $9 above its pre-war level. The market expects the worst of the immediate shortage to ease, but it is still pricing in a higher medium-term energy cost backdrop.
Inflation does not fade as quickly as oil spikes do. Once the shock moves into freight, food, industrial inputs, and regulated prices, it keeps working through the economy long after crude has pulled back from its peak. That is why a front-loaded oil shock can still produce a slower and more persistent inflation cycle.
Why Inflation Forecasts Can Rise Further Out Even as Oil Moderates
The rise in Turnleaf’s longer-horizon inflation forecasts is consistent with the oil curve once the focus shifts from spot crude to the channels through which energy shocks feed into prices.
Part of the reason is timing. Signs of energy stress often appear in port activity, shipping costs, refinery margins, and freight markets before they show up in headline CPI. More recent forecast vintages can therefore capture supply-chain pressure that earlier data missed.
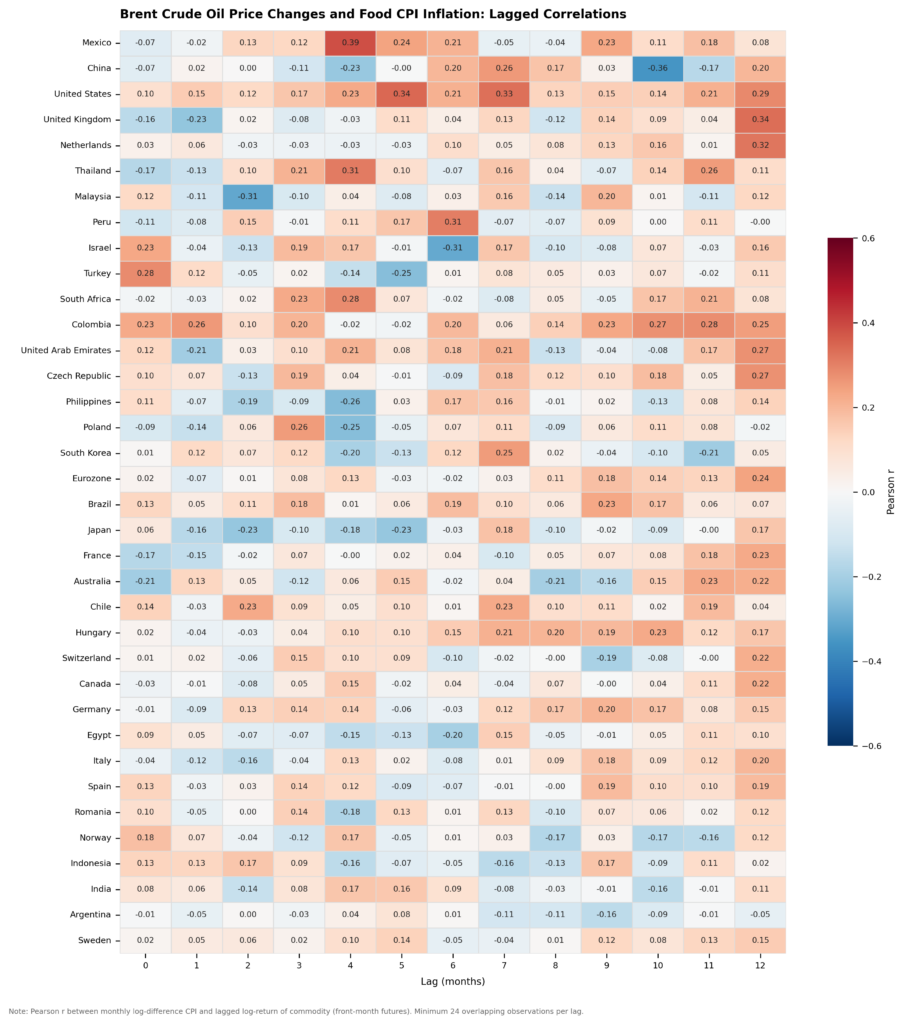
The food channel is slower still. Food prices usually respond only after higher fuel, freight, fertiliser, and processing costs move through agricultural supply chains (Figure 2). In the current episode, with urea already sharply higher, that raises the risk that food inflation becomes more visible later in the six-month horizon even if spot crude eases before then.
Figure 2
Expectations matter as well. The earlier 12-day conflict was largely treated as contained. The closure of Hormuz forced a broader reassessment of how long disruption across the energy complex could last. That affects business behaviour well beyond the pump, including how firms absorb costs and when they choose to pass them on.
The broader point is that inflation responds more slowly, and through more channels, than oil prices do. Freight costs tend to adjust first, but the effects then spread more gradually through manufacturing, food, and eventually wages. By the time those pressures become visible in consumer prices, crude may already have moved off its peak. That is why a sharp energy shock can fade quickly in the market while continuing to build in the real economy.
Why Policy Regimes Widen the Wedge
To read the rest, visit our latest Substack post, here.