
Commercial traffic through the Strait of Hormuz has been severely disrupted since 28 February 2026 and has not meaningfully normalised. Lloyd’s List Intelligence counted just 73 transits in the week to 16 August, around 10 a day, against roughly 103 trading vessels a day before the conflict. Marsh reported additional war risk premiums of 7.5 to 10% of hull value on 22 July, up from 1 to 3% a few weeks earlier. Brent was $93.27 a barrel on 21 August, 37.7% above a year ago, and Dutch TTF gas was €66.52 per MWh, 98.1% higher. A second shock is building in parallel. The US Climate Prediction Center has moved to an El Niño Advisory and now puts a greater than 90% probability on a very strong event through the northern hemisphere autumn and winter. Textiles sit downstream of both. Energy prices set the cost of synthetic fibre and of moving finished garments, and El Niño is an important determinant of cotton yields and availability. Neither has yet registered in clothing and footwear inflation across the major advanced economies. We expect these costs to reach retail prices with a lag of several quarters, and our proprietary apparel index has already begun to reflect that.
Two Channels, Two Speeds
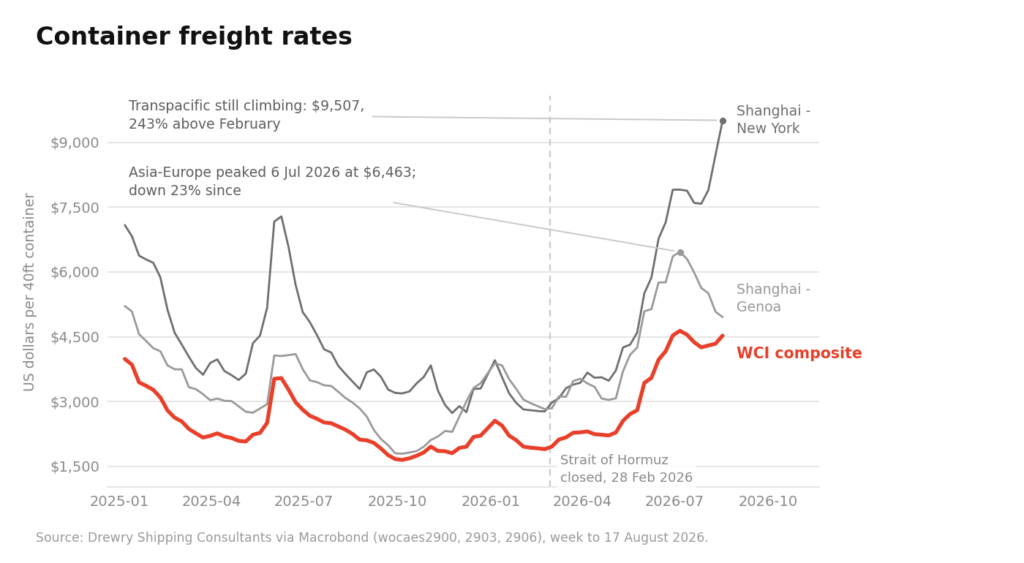
The faster channel runs through energy. Polyester is roughly 59% of world fibre supply against 19% for cotton, which makes the average garment a petrochemical product whose cost moves with crude. That cost has carried through to the fibre itself, with Asian polyester staple prices rising 12 to 15% quarter on quarter in the second quarter as paraxylene followed oil higher. Spot container freight has moved the same way. Drewry’s World Container Index, a weekly composite of eight major East-West lanes, is some 60% above its late-May level, and the move is concentrated on the transpacific, where Shanghai to New York is running at $9,507 per 40ft container, 243% above February, while Asia to Europe has fallen 23% from its July peak (Figure 1). Most apparel volume moves under annual contracts, which reprice with a lag, so today’s spot level indicates what importers will pay at the next negotiation more than what they are paying now. Rebased to January 2026, the month before the closure, European gas was 50% higher in July and Brent 30% higher, and both remain elevated.
Figure 1
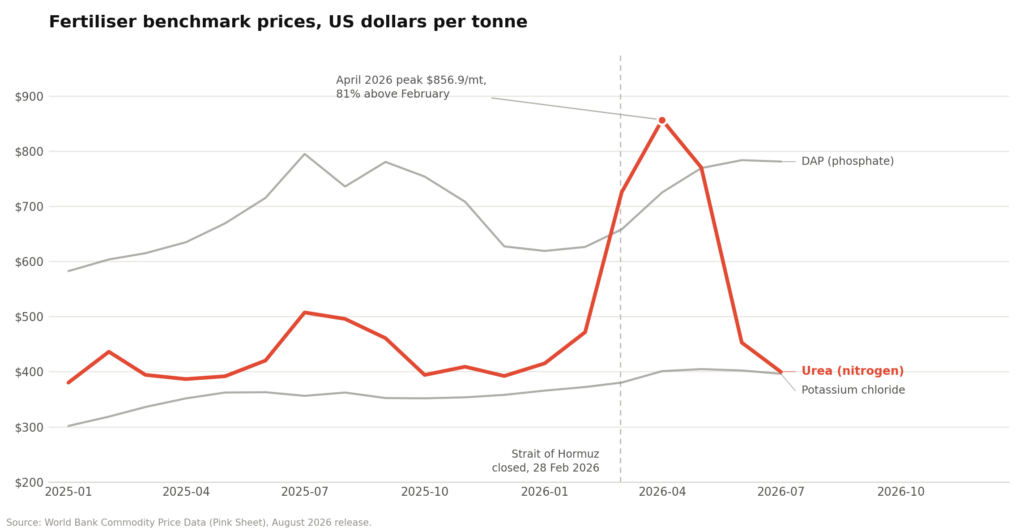
The slower channel runs through agriculture. The fertiliser shock has already peaked and largely reversed, while cotton remains under upward pressure. The Middle East accounts for nearly a quarter of global urea exports, and urea duly rose 81% between February and April before the entire move unwound over the following three months (Figure 2). Phosphates and potash barely participated, because nitrogen fertiliser is synthesised from natural gas and urea therefore traded as an energy derivative through the closure while the mined nutrients did not. Benchmark urea prices have reversed, although that relief has not reached domestic producer prices, with the US producer price index for fertiliser materials still 21% above its January level in July.
Figure 2
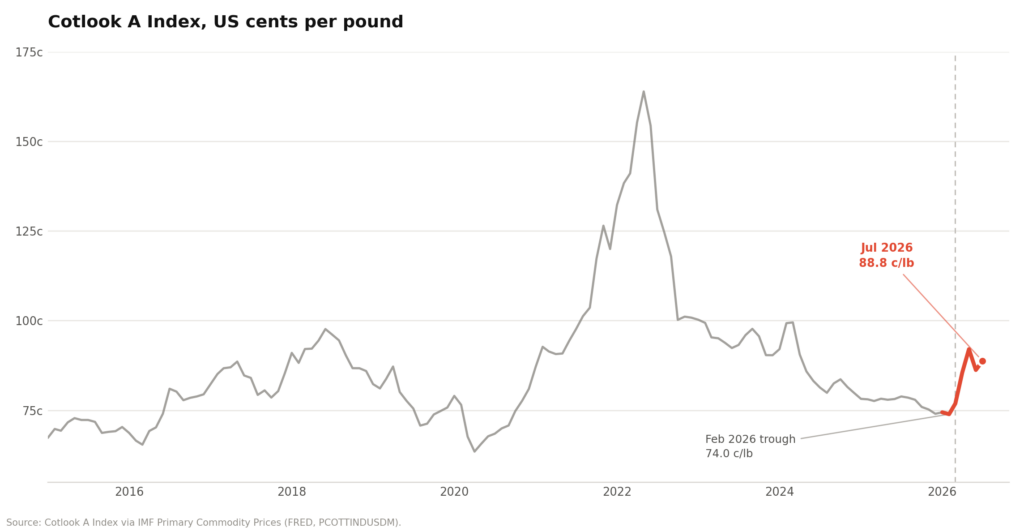
Cotton is where El Niño enters the cost base. India’s June to July monsoon delivered 87% of the long-period average, pushing cotton sowing sharply below year-ago levels before late rains narrowed the shortfall. Prices followed, with the Cotlook A Index rising from a February trough of 74.0 cents a pound to 88.8 cents in July and ICE cotton settling at 88.33 cents on 20 August, 34.2% above a year ago, which leaves the market at its highest since early 2024 (Figure 3). The tightness is structural as well as seasonal, with world ending stocks projected at their lowest since 2011/12 and mill use exceeding production by 5.3 million bales.
Figure 3
What Our Apparel Index Is Showing
To gain access to Turnleaf’s proprietary Apparel indicies for development markets and the rest of this article, visit our latest Substack post, here.