Gold has stopped trading as a clean derivative of US real yields and now reflects a broader external pricing regime. Since 2022, the real-yield anchor has weakened, gold has lined up more consistently with broad-dollar moves, and episodes of dollar tightening have coincided with more synchronized depreciation within a basket of emerging-market currencies. Inflation outcomes also show episodic fragmentation. Dispersion widens sharply during the 2021–22 shock, compresses through 2023–24, and then widens around 2025. The figures below trace this rotation in drivers and show how it propagates into inflation through exchange rates, tradables pricing, and country-specific pass-through.
The breakdown of the real yield anchor
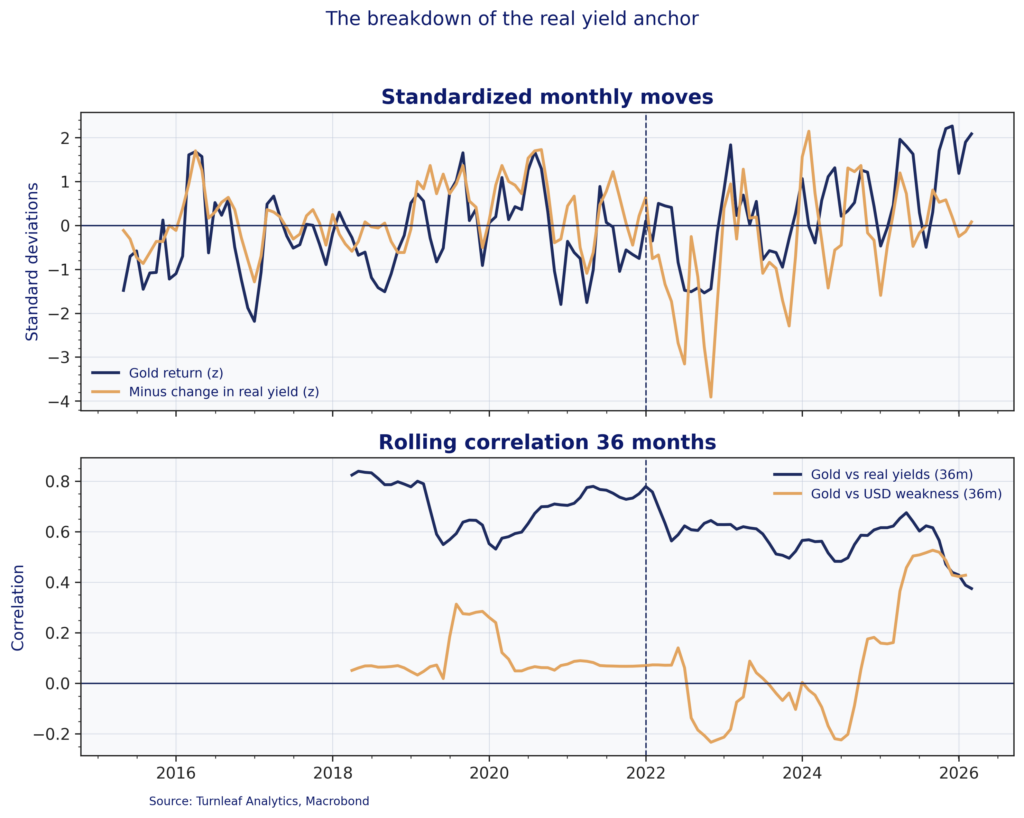
For much of the past decade, real yields offered a reliable framework for thinking about gold. When inflation-adjusted returns on safe assets fell, gold typically benefited. Since 2022, that relationship has weakened. US 10-year real yields rose sharply to post-GFC highs, yet gold remained resilient and went on to set successive record highs through 2025. Figure 1 captures the shift. The rolling correlation between gold and real yields trends lower after 2022, while the correlation between gold and broad-dollar weakness rises into 2025, which is consistent with gold rotating from a rate-dominated signal toward a more FX-sensitive regime.
Emerging-market central banks have helped drive this decoupling by diversifying reserves away from dollar assets. Their buying changes the marginal source of demand and shifts the transmission mechanism. Gold increasingly responds through exchange rates and import-price dynamics via the cost of dollars and local-currency purchasing power, rather than primarily through the domestic real-rate channel.
Figure 1
The dollar channel and EM currency clustering
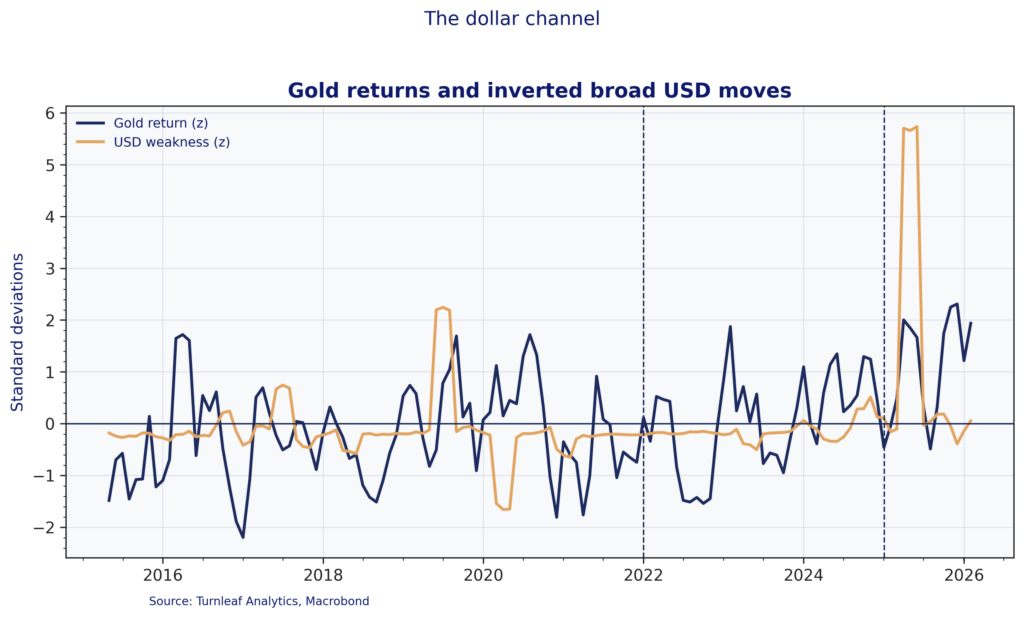
In the current regime, gold strength often lines up with broad-dollar weakness because exchange-rate moves pass through quickly into traded goods and import prices. Figure 2 shows this by plotting gold returns against an inverted broad-dollar index return series. The relationship is episodic, but the co-movement becomes more visible in stress windows, including the large dollar move around the 2025 marker.
Figure 2
For emerging markets, the key issue is synchronicity within the basket rather than idiosyncratic single-country moves. Figure 3 pairs standardized broad-dollar index returns with an EM depreciation basket and a breadth measure that tracks how many currencies in this basket depreciate at the same time. Breadth stays low in most months but rises in stress episodes, which captures the clustering mechanism in practice: the distribution shifts toward shared drawdowns when the broad-dollar strengthens and funding conditions tighten.
Figure 3
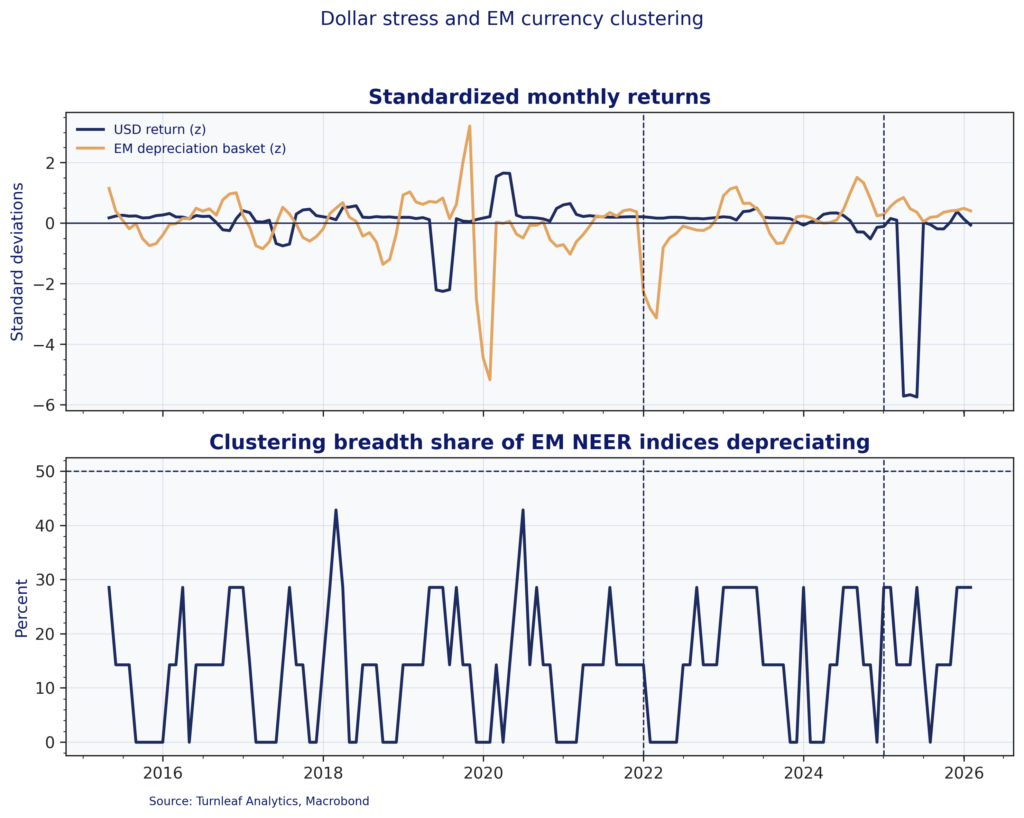
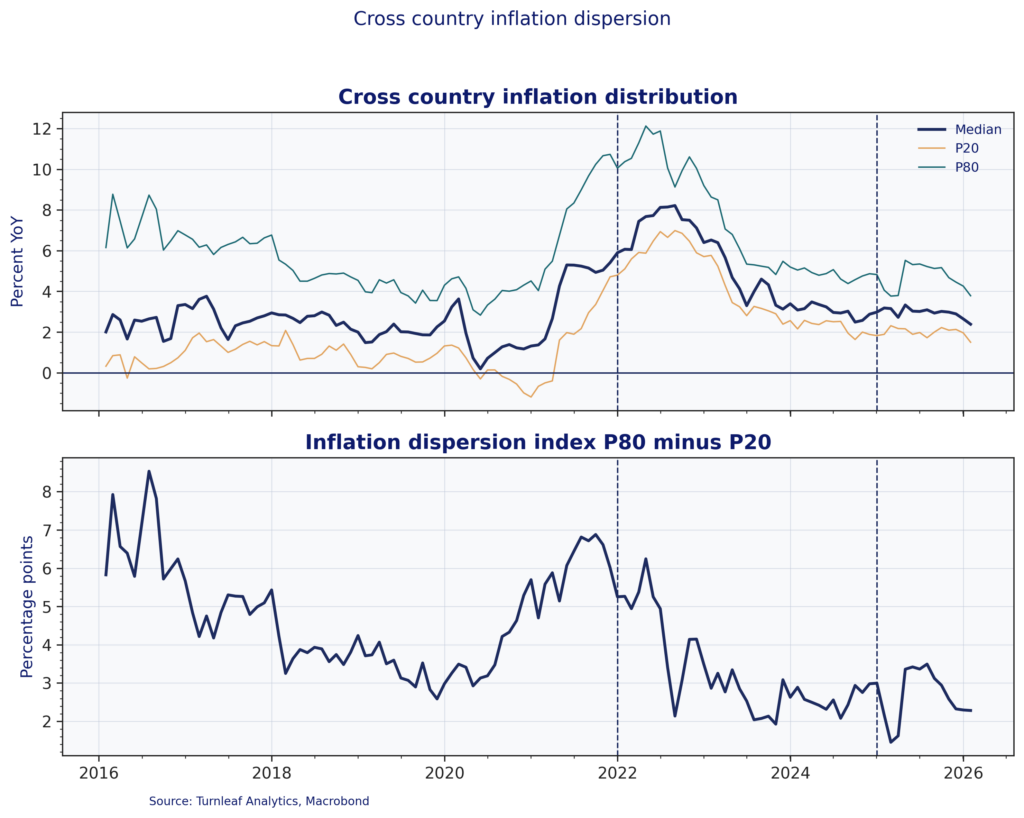
Figure 4 checks whether the shift in transmission shows up in realized outcomes by plotting the cross-sectional distribution of headline CPI inflation across the sample and a trimmed dispersion metric defined as the P80–P20 spread. The sample combines advanced economies and major emerging markets (United States, Eurozone, United Kingdom, Japan, Canada, China, India, Brazil, Mexico, Turkey, South Africa). Dispersion rises into the 2021–22 inflation shock as inflation outcomes fan out across countries, then compresses sharply through 2023 and 2024 as inflation re-converges. The modest widening around 2025 suggests renewed fragmentation, but at a far smaller scale than 2022.
Figure 4
Country-level transmission
The shift from yield-driven to reserve-driven gold increases the scope for inflation dispersion based on structural archetypes.
China is a structural contributor. The PBoC has been an important contributor to the current regime through price-insensitive gold accumulation to reduce exposure to US Treasuries. While domestic inflation in China is muted by capital controls and managed exchange rates, reserve diversification affects the marginal demand for dollars and reshapes global pricing conditions for other economies.
Turkey illustrates regime-dependent pass-through. Turkey’s exchange rate is not a clean market price, because policy has often leaned on reserves, regulation, and administrative measures to smooth or delay depreciation. That does not remove pass-through, it changes its timing and its form.
To read the rest, consider subscribing to Turnleaf’s Substack, here.