
Every time I watch the FIFA World Cup, there’s always something that surprises me. I didn’t expect Japan to score against Brazil in the first half, nor did I expect Cape Verde to tie with Spain. When about 70,000 people flock to host cities like Kansas City to watch Algeria play against Austria, demand surges for hotels, airfares, restaurants, and local transport. Prices respond, and, like a World Cup match, the inflation data can throw up surprising results.
Hosting the FIFA World Cup creates a concentrated demand surge against largely fixed local capacity. Hotel rooms are among the most capacity-constrained prices, so much of the adjustment tends to show up there. To test this pattern, we examine how the relevant CPI subcomponents moved in Brazil and South Africa around the 2014 and 2010 tournaments, respectively.
Figure 1 shows changes in the relevant CPI subcomponents for Brazil and South Africa around the 2014 and 2010 World Cups, respectively. Hotels show the clearest coincident tournament spike before normalising within months. Restaurant inflation is essentially unchanged, while airfare inflation is too volatile to isolate a clean event effect. Hotel inflation rose sharply during the tournament window in both countries, peaking at around 40% YoY in Brazil and around 20% YoY in South Africa before reversing soon after.
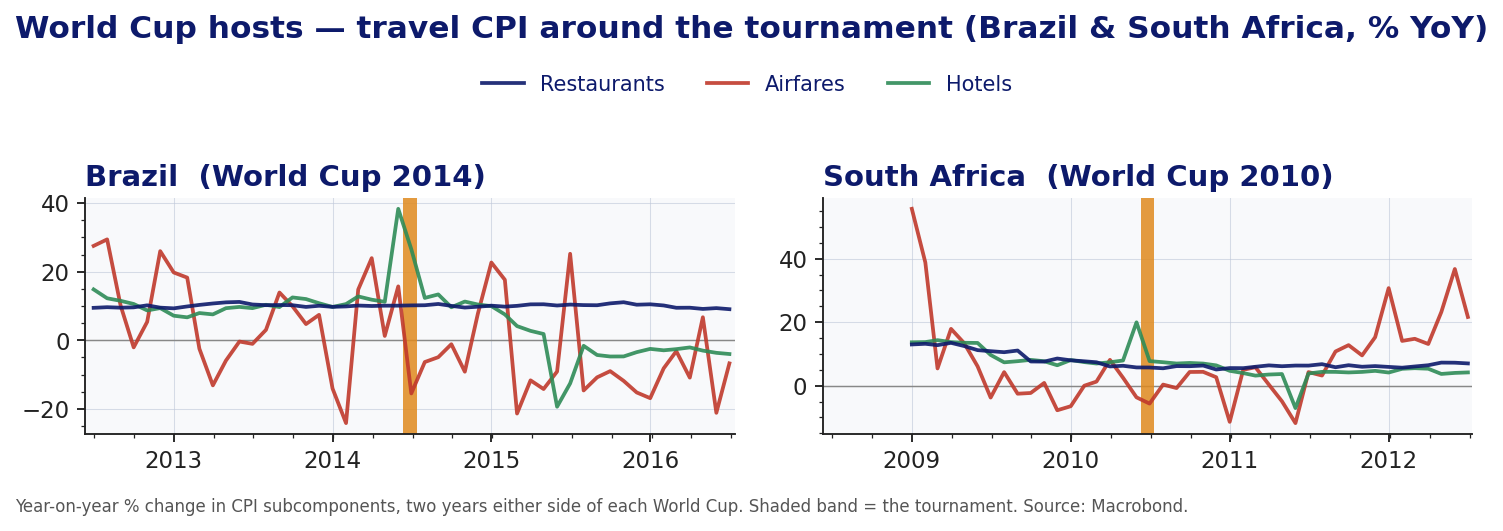
Figure 1. YoY change in travel CPI components – hotels, airfares, and restaurants – two years on either side of each World Cup. The shaded band marks the tournament.
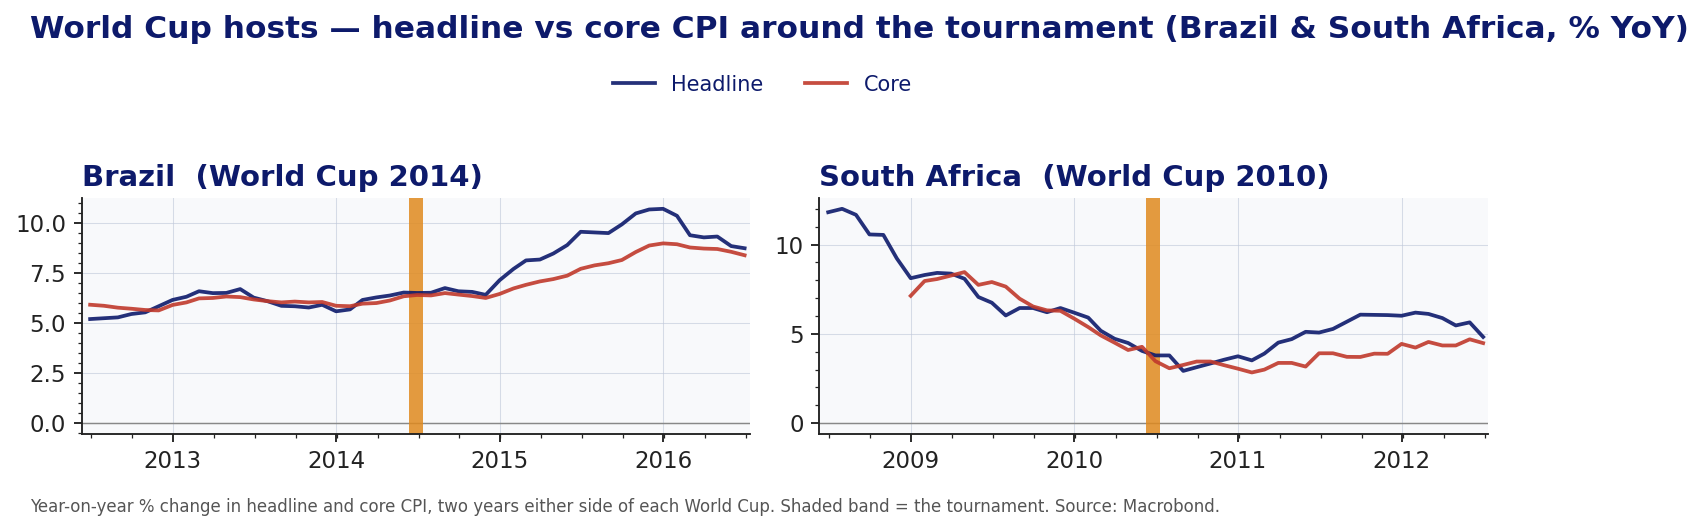
The second stage determines whether the spike reaches the national index. That depends on basket weights. In both economies, airfares and accommodation were small CPI weights, while restaurants were several times larger, so even a sharp hotel spike was small. Headline and core inflation show no discernible tournament break (Figure 2). Brazil held near 6.5% YoY through the window, while South Africa continued a pre-existing disinflation from about 12% YoY toward 4% YoY. Core broadly tracked headline, suggesting no obvious propagation beyond accommodation. The later rise in Brazilian inflation reflected broader macro pressures – including administered prices, depreciation, and recession – rather than the tournament.
Figure 2. YoY change in headline and core CPI, two years on either side of each World Cup. The shaded band marks the tournament.
What we are watching for in 2026
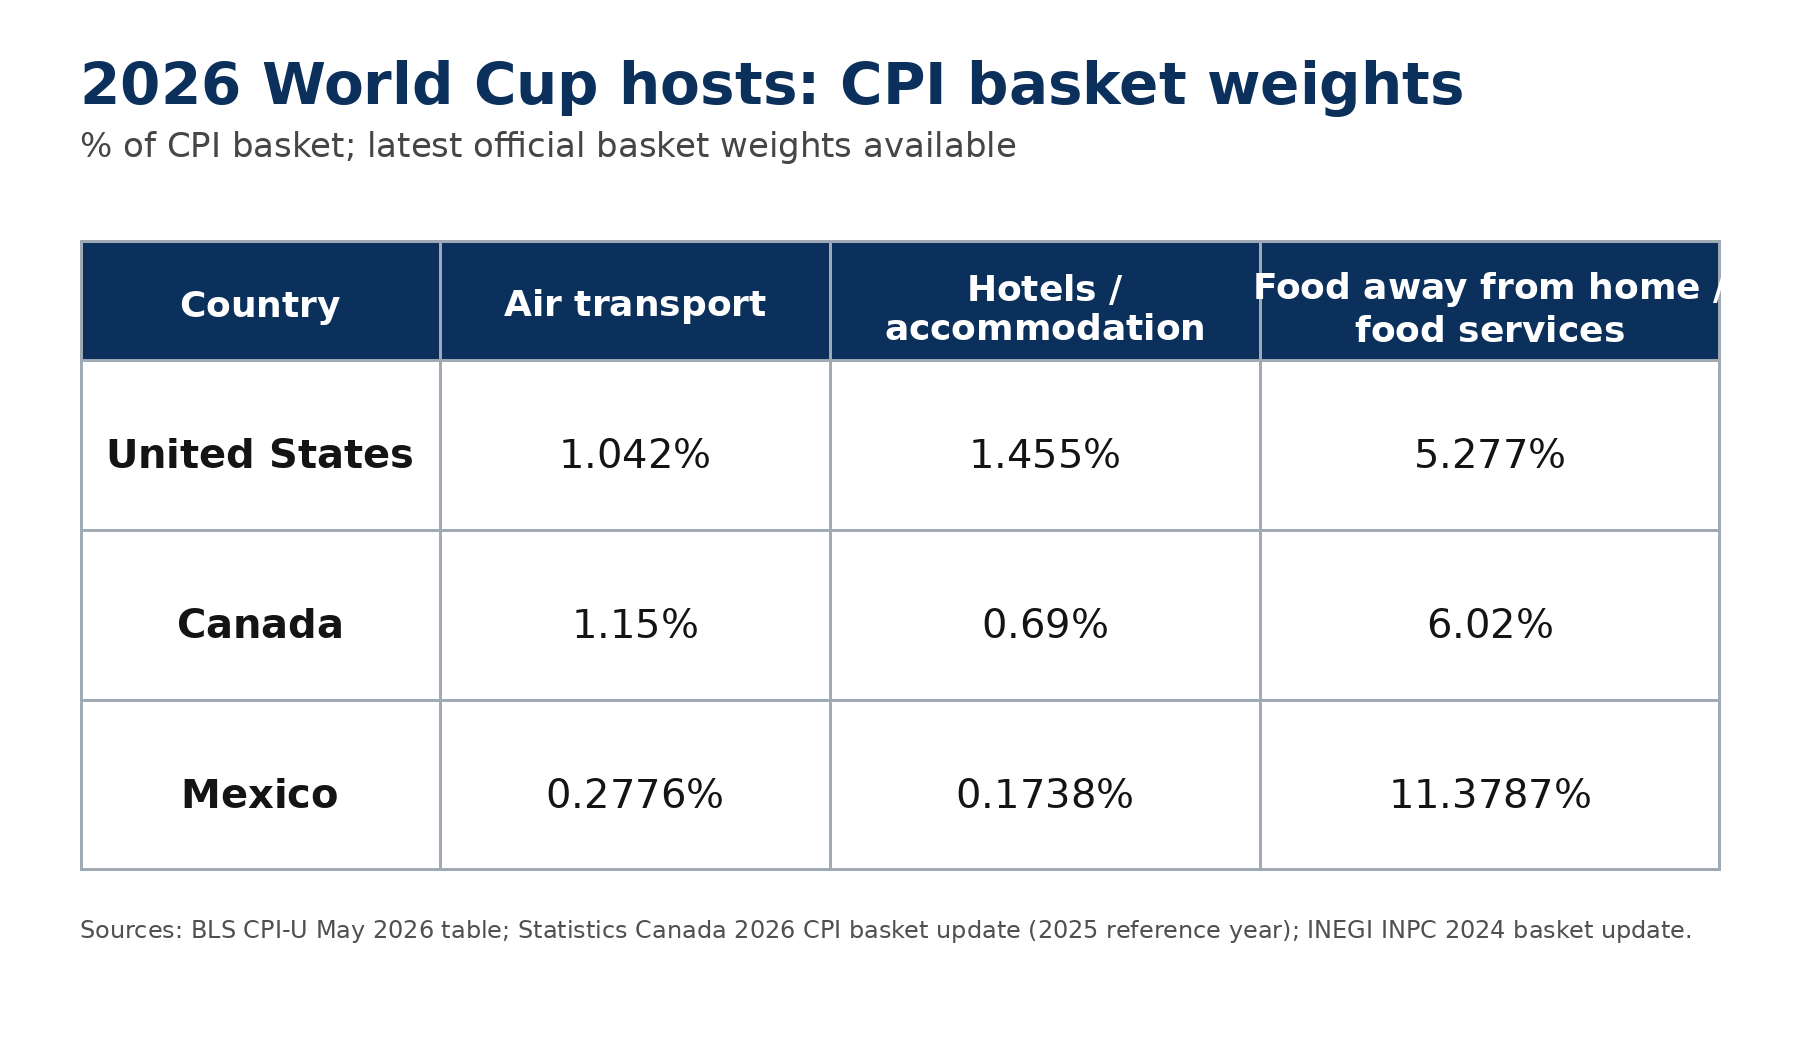
For the 2026 World Cup across the United States, Canada, and Mexico, the base case is a sharp but local rise in service prices with limited and temporary national inflation impact. The scale is bounded by the relevant CPI basket weights: air transport and accommodation are small components in all three hosts, while food services carry a larger weight but are less directly capacity-constrained by the tournament (Figure 3).
Figure 3. Approximate CPI basket weights for selected travel and hospitality components in the 2026 World Cup host countries, percent of national CPI basket.
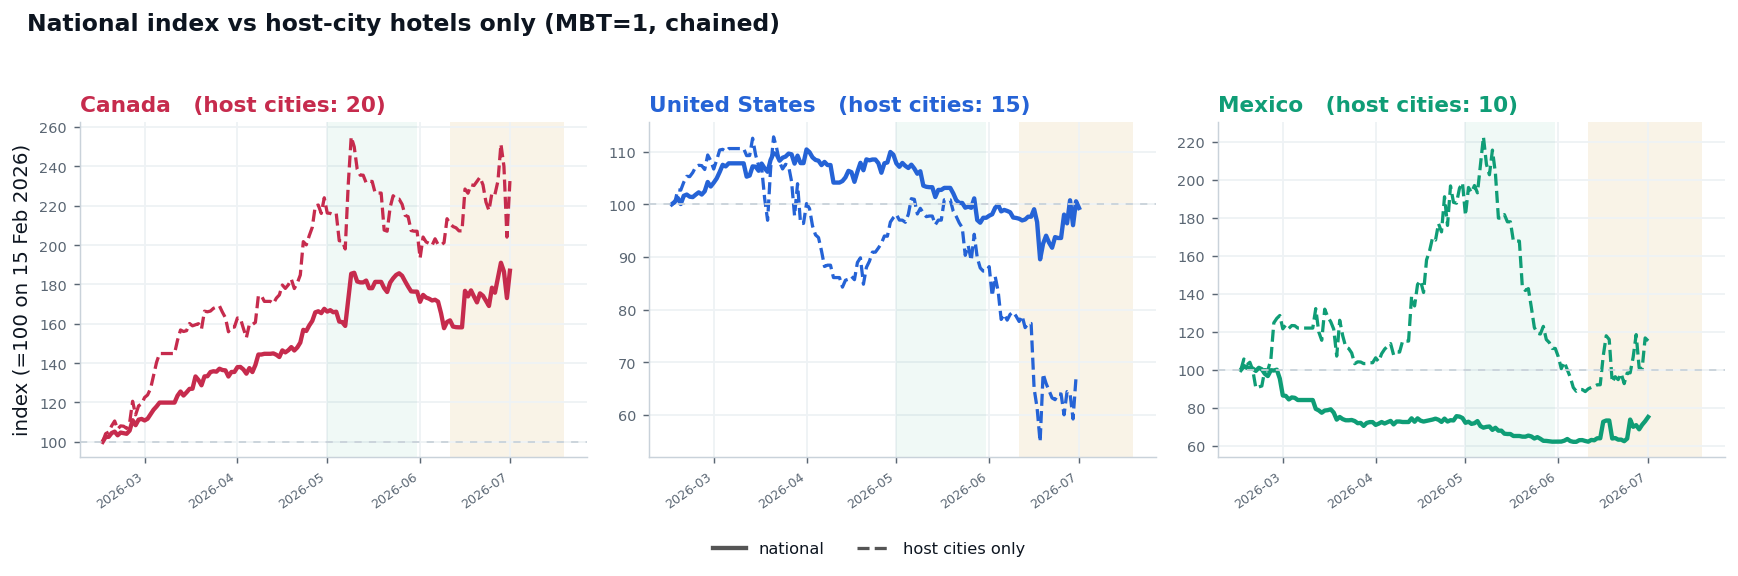
A timely FIFA proxy comes from Turnleaf’s proprietary hotel price index, which tracks daily advertised nightly rates for future stays. Measured one month before travel, host-city rates in Canada and Mexico are running well above their national indexes into the tournament windows – a clear premium of the kind that basket weights then dilute at the national level (Figure 4). In the United States, that premium is absent so far, with advertised host-city rates easing relative to the national index. We read this as early and partial, and expect the host-city premium to build through the June and July match windows before reversing once the crowds leave.
Figure 4. Turnleaf preliminary hotel price index: national versus host-city advertised nightly rates, measured one month before travel and indexed to 15 February 2026. The shaded bands mark the group-stage and knockout windows.
The base case remains a clear local accommodation spike and a limited mark on national 12-month inflation trajectory.
So will inflation surprise us like the last few matches? With Turnleaf’s access to extensive high-frequency and alternative data, that risk is more measurable – and less likely to catch us off guard.