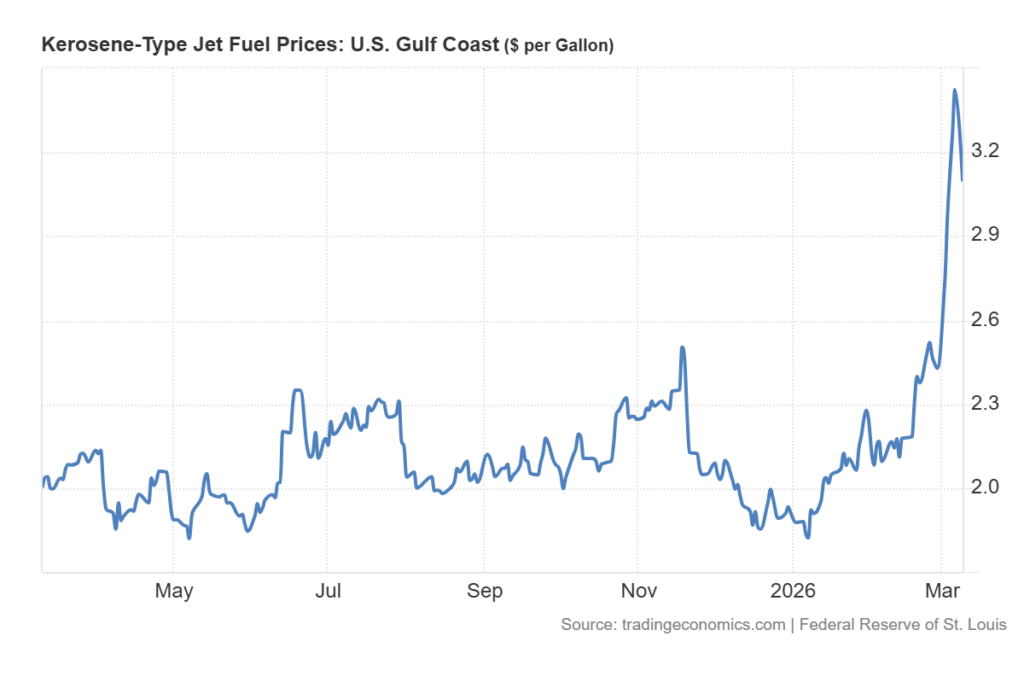
The war in Iran has persisted far longer than anticipated, driving sustained increases in global commodity prices. These pressures are now filtering into downstream products derived from crude oil, particularly jet fuel (Figure 1). As fuel costs rise, airlines are facing higher operating expenses while demand for flights out of affected regions remains elevated. This combination of cost pressures and demand dynamics is pushing airfares higher.
Figure 1
To quantify the rise in airfare prices, Turnleaf leverages its proprietary daily airfare index, which tracks thousands of ticket prices across 35 countries for travel within the next four weeks. As shown in Figure 2, fares increased by as much as 45% across markets between the last week of February 2026 and the week of March 18, 2026.
Figure 2
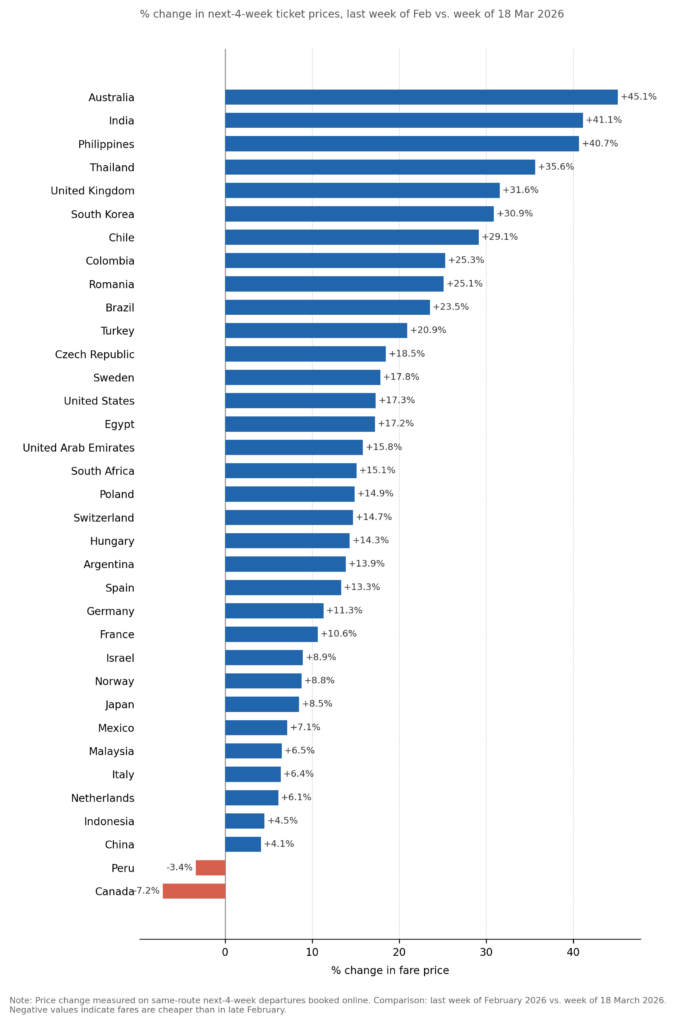
The dispersion across countries is substantial and reflects a combination of geographic exposure, network structure, and demand shocks. The largest increases are concentrated in Asia-Pacific markets such as Australia (+45%), India (+41%), and the Philippines (+41%), where long-haul dependency and limited substitution toward alternative transport amplify the pass-through of higher jet fuel costs. These markets are also more exposed to rerouting effects and capacity tightening as airlines adjust flight paths and schedules in response to regional instability.
In contrast, North America and parts of Europe show more moderate increases, with the United States (+17%) and core European markets largely in the 10–18% range. These regions benefit from more competitive airline markets, denser route networks, and a higher share of short-haul travel, which dampens price sensitivity to fuel shocks. Notably, Canada (-7%) and Peru (-3%) are outliers, suggesting localized demand softness or excess capacity that is offsetting upward cost pressures.
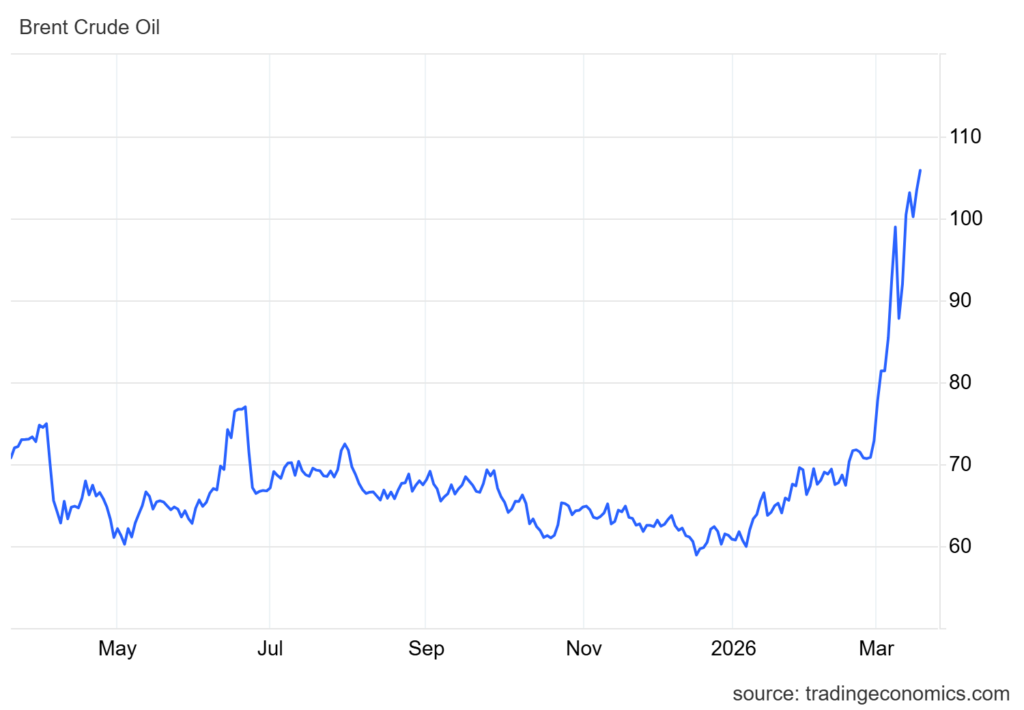
We will continue to monitor airfare dynamics as the conflict evolves. Upward pressure is likely to persist, with Brent crude approaching $110 per barrel and showing little indication of near-term relief (Figure 3).
Figure 3